
This Is Why Tesla (NASDAQ:TSLA) Stock Is Rising… – Live Trading News
$TSLA #Tesla #Auto #Manufacturers #USA #Nasdaq #Stocks #Trading
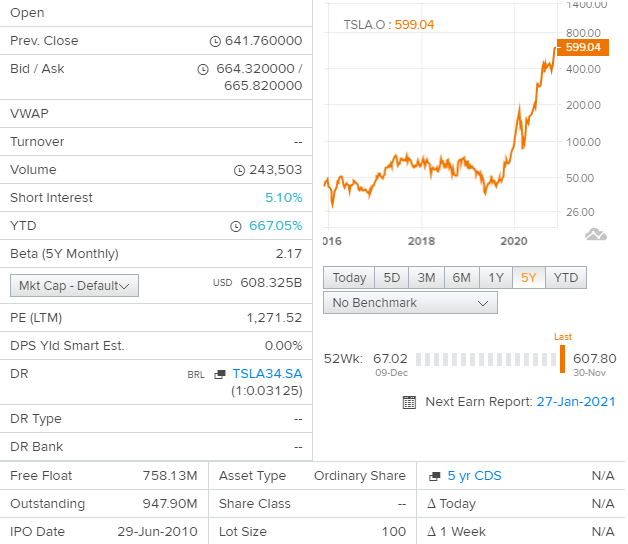
Tesla
Ticker: NASDAQ:TSLA
Price: $641.76
Tesla News
Shares of Tesla (NASDAQ: TSLA) are continuing their upward momentum this week. The stock soared past $600 to a new all-time high, pushing the electric-car maker’s market capitalization to almost $600 billion. Shares rose as much as 5.2% on Monday but were up about 4.5% as of 11:30 a.m., with the stock trading at about $626.
The stock’s rise is likely a continuation of momentum higher in recent weeks as well as a bullish day in the market for many growth stocks like Tesla.
Shares of Tesla have risen more than 45% during the last month. Much of the momentum has been spurred by news that the stock is set to be included in the S&P 500 this month. Several analysts have also recently boosted their price targets for the stock. One analyst last week set a 12-month price target of $780.
Business Summary
Tesla, Inc., formerly Tesla Motors, Inc., designs, develops, manufactures and sells fully electric vehicles, and energy storage systems, as well as installs, operates and maintains solar and energy storage products.
The Company operates through two segments: Automotive, and Energy generation and storage.
The Automotive segment includes the design, development, manufacturing, and sales of electric vehicles.
The Energy generation and storage segment includes the design, manufacture, installation, and sale or lease of stationary energy storage products and solar energy systems to residential and commercial customers, or sale of electricity generated by its solar energy systems to customers.
The Company produces and distributes two fully electric vehicles, the Model S sedan and the Model X sport utility vehicle (SUV). It also offers Model 3, a sedan designed for the mass market.
It develops energy storage products for use in homes, commercial facilities and utility sites.
Price Performance
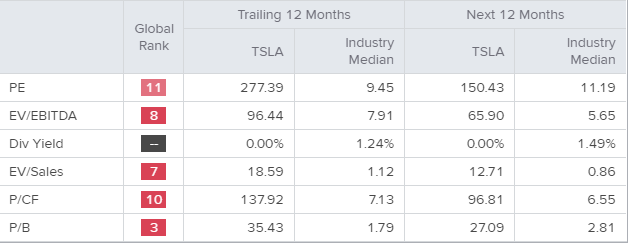
Relative Valuation
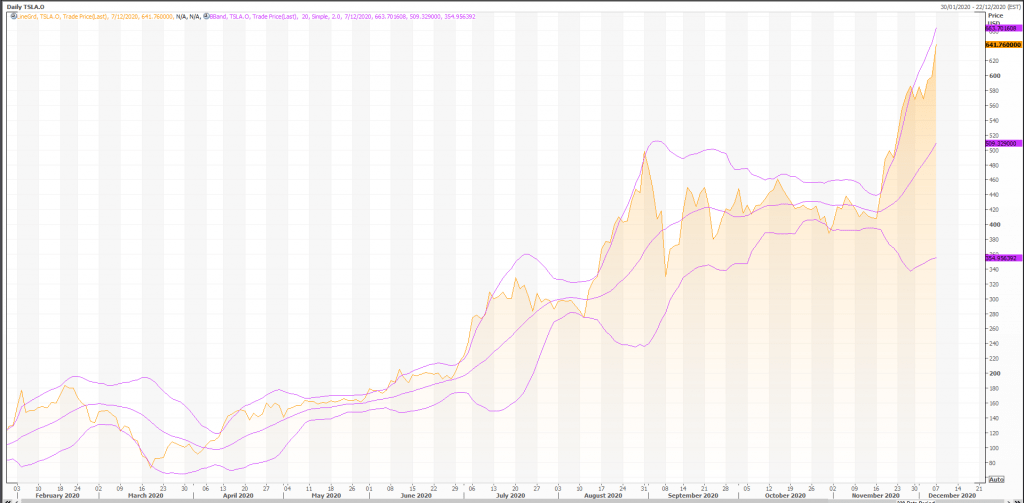
Technical Indicators
Overall, the bias in prices is: Upwards.
Note: this chart shows extraordinary price action to the upside.
By the way, prices are vulnerable to a correction towards 475.20.
The projected upper bound is: 695.72.
The projected lower bound is: 597.18.
The projected closing price is: 646.45.
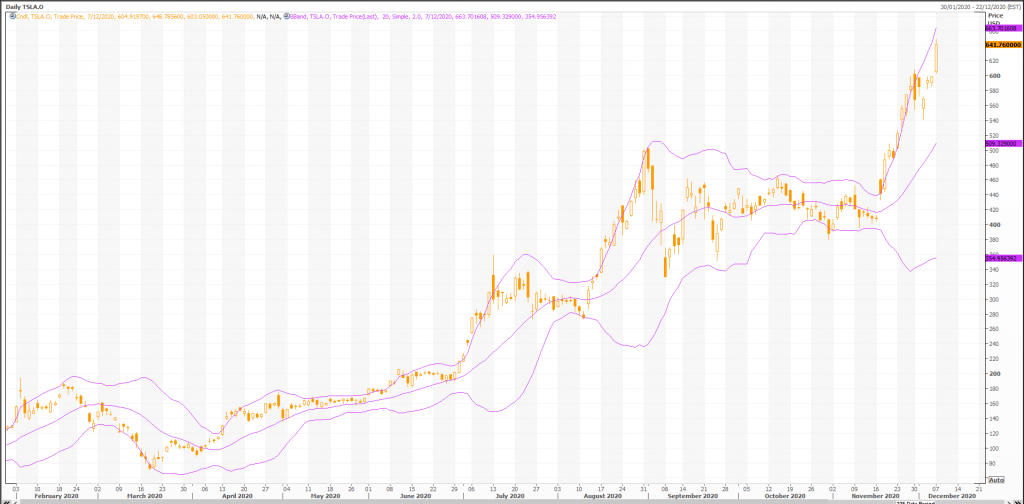
Candlesticks
A big white candle occurred. This is generally considered bullish, as prices closed significantly higher than they opened. If the candle appears when prices are “low,” it may be the first sign of a bottom. If it occurs when prices are rebounding off of a support area (e.g., a moving average, trendline, or retracement level), the long white candle adds credibility to the support. Similarly, if the candle appears during a breakout above a resistance area, the long white candle adds credibility to the breakout.
During the past 10 bars, there have been 8 white candles and 2 black candles for a net of 6 white candles. During the past 50 bars, there have been 26 white candles and 24 black candles for a net of 2 white candles.
A rising window occurred (where the top of the previous shadow is below the bottom of the current shadow). This usually implies a continuation of a bullish trend. There have been 8 rising windows in the last 50 candles–this makes the current rising window even more bullish.
Three white candles occurred in the last three days. Although these candles were not big enough to create three white soldiers, the steady upward pattern is bullish.
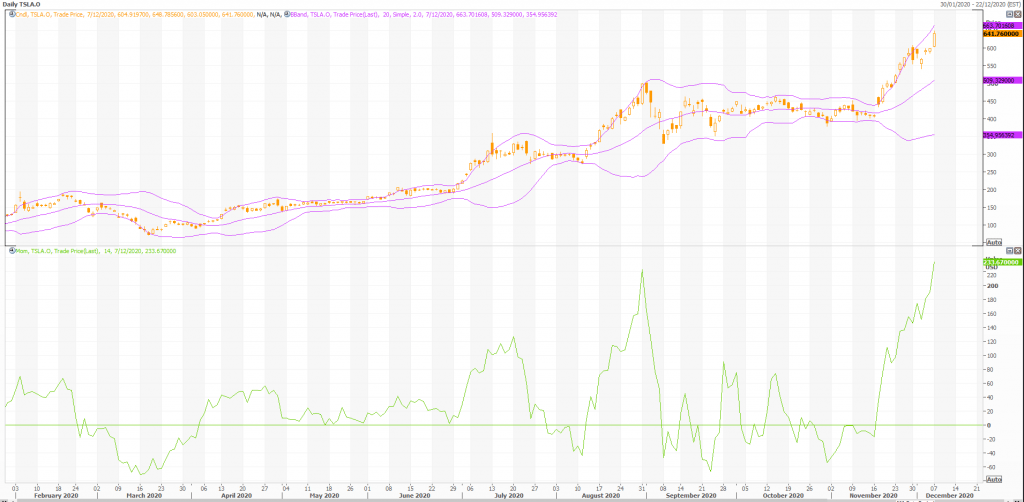
Momentum Indicators
Momentum is a general term used to describe the speed at which prices move over a given time period. Generally, changes in momentum tend to lead to changes in prices. This expert shows the current values of four popular momentum indicators.
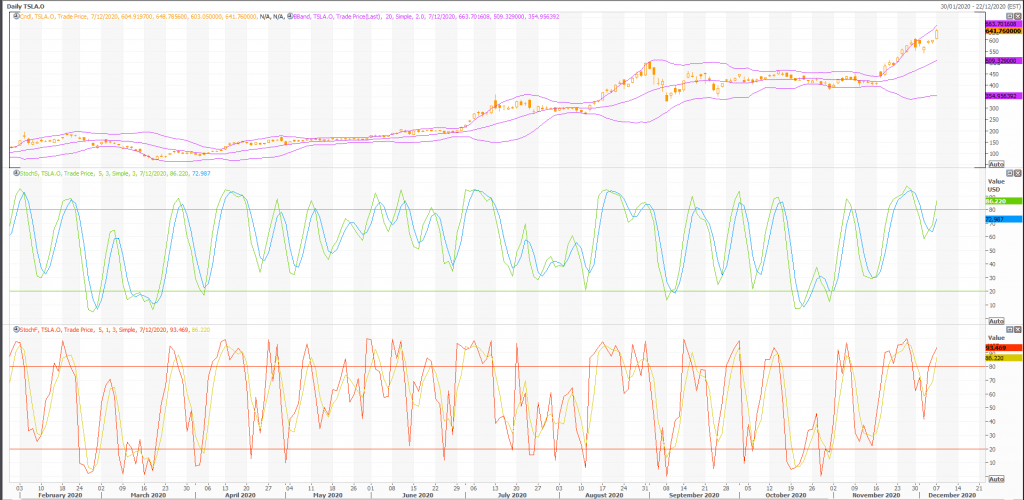
Stochastic Oscillator
One method of interpreting the Stochastic Oscillator is looking for overbought areas (above 80) and oversold areas (below 20). The Stochastic Oscillator is 87.4538. This is an overbought reading. However, a signal is not generated until the Oscillator crosses below 80 The last signal was a sell 4 period(s) ago.
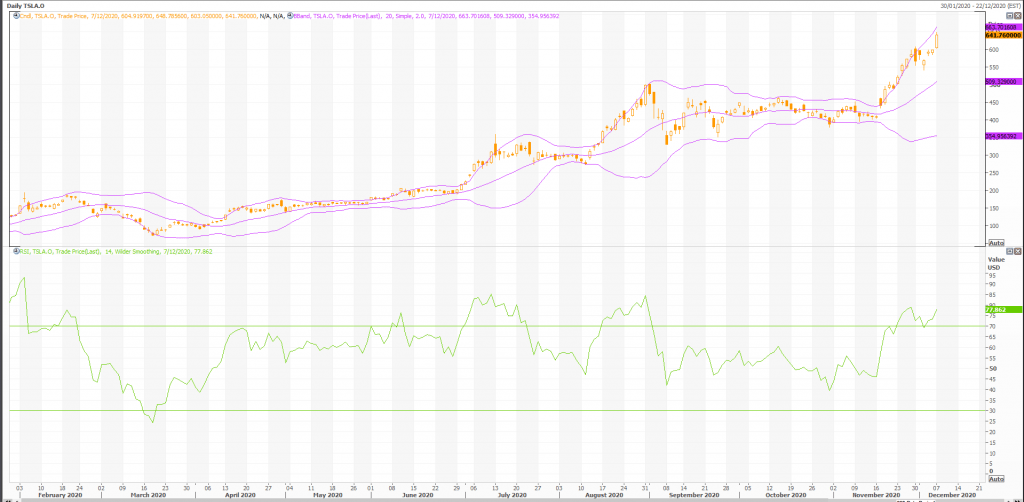
Relative Strength Index (RSI)
The RSI shows overbought (above 70) and oversold (below 30) areas. The current value of the RSI is 77.86. This is where it usually tops. The RSI usually forms tops and bottoms before the underlying security. A buy or sell signal is generated when the RSI moves out of an overbought/oversold area. The last signal was a sell 3 period(s) ago.
MACD
The Moving Average Convergence/Divergence indicator (MACD) gives signals when it crosses its 9 period signal line. The last signal was a buy 13 period(s) ago.
Rex Takasugi – TD Profile
TESLA INC closed up 42.720 at 641.760. Volume was 100% below average (consolidating) and Bollinger Bands were 145% wider than normal.
Open High Low Close Volume 604.920 648.786 603.050 641.760 246,953 Technical Outlook Short Term: Overbought Intermediate Term: Bullish Long Term: Bullish Moving Averages: 10-period 50-period 200-period Close: 579.23 459.36 288.19 Volatility: 64 66 109 Volume: 41,376,184 38,504,340 70,119,296
Short-term traders should pay closer attention to buy/sell arrows while intermediate/long-term traders should place greater emphasis on the Bullish or Bearish trend reflected in the lower ribbon.
Summary
TESLA INC gapped up today (bullish) on light volume. Possibility of a Common Gap which usually coincides with a lack of interest in the security. Common Gaps are fairly irrelevent for forecasting purposes. Four types of price gaps exist – Common, Breakaway, Runaway, and Exhaustion. Gaps acts as support/resistance.
TESLA INC is currently 122.7% above its 200-period moving average and is in an upward trend. Volatility is relatively normal as compared to the average volatility over the last 10 periods. Our volume indicators reflect moderate flows of volume into TSLA.O (mildly bullish). Our trend forecasting oscillators are currently bullish on TSLA.O and have had this outlook for the last 12 periods. Our momentum oscillator is currently indicating that TSLA.O is currently in an overbought condition. The security price has set a new 14-period high while our momentum oscillator has not. This is a bearish divergence.