
Technical Setups for Euro: EUR/USD (EUR=X) with Charts – Live Trading News
Euro Outlook
EUR/USD trimmed its gains in early U.S. trade and may face difficulty retaking its 1.1880 October highs until the dust settles on the U.S. election and its implications for fiscal and monetary policy become more clear.
After the two-day rebound reached overbought status and retreated to 1.1801, risk-sensitive EUR/USD may need a rise in the S&P 500 to clear its October and September peaks before the euro can mount an assault on 1.1880.
EUR/USD has largely tracked the stock market before and after the U.S. election, until peaking on Thursday at 1.1860, near October’s 1.18805 EBS top.
Trade with Confidence with Knightsbridge Live
Ultimately, a bullish EUR/USD view will depend on the outlook for stimulus and taxation in light of a divided U.S. Congress while the U.S. grapples with the COVID-19 second wave and early indications European and U.S. economies are already losing momentum.
Euro/US Dollar Exchange Rate
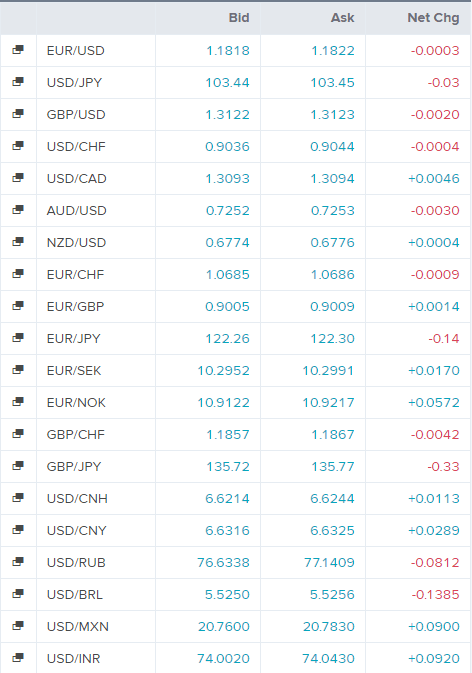
Today’s Forex Rates
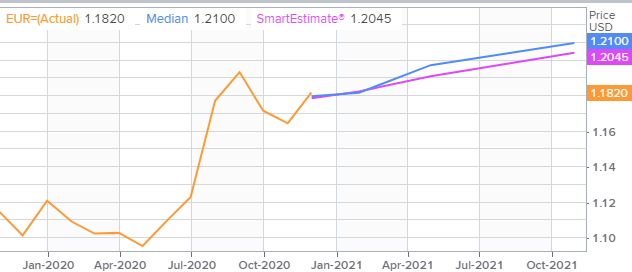
EUR/USD FX Polls
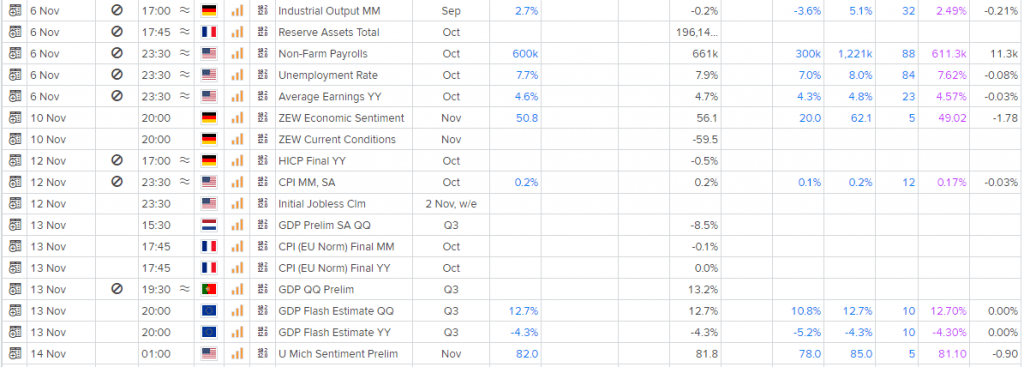
Economic Events
Technical Indicators
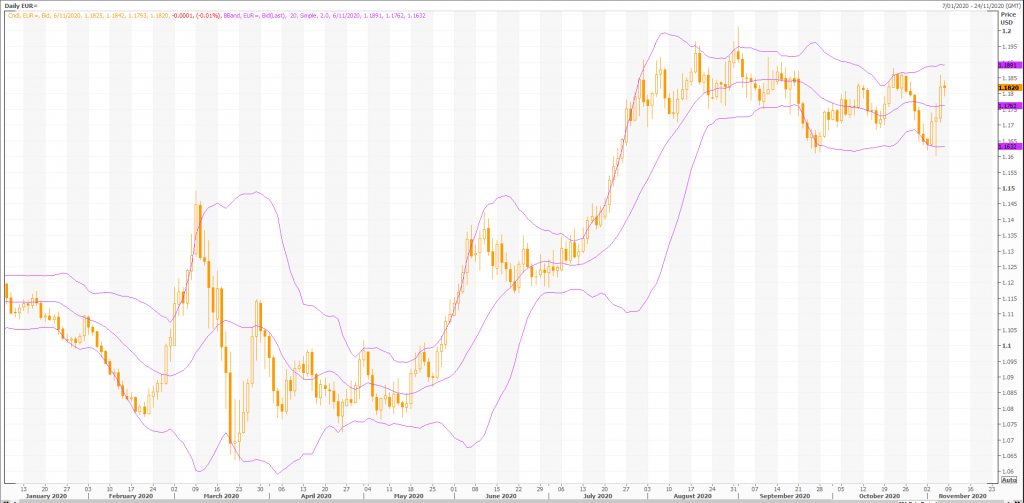
Overall, the bias in prices is: Upwards.
By the way, prices are vulnerable to a correction towards 1.16.
The projected upper bound is: 1.19.
The projected lower bound is: 1.17.
The projected closing price is: 1.18.
Candlesticks
A black body occurred (because prices closed lower than they opened).
During the past 10 bars, there have been 3 white candles and 7 black candles for a net of 4 black candles. During the past 50 bars, there have been 22 white candles and 28 black candles for a net of 6 black candles.
A spinning top occurred (a spinning top is a candle with a small real body). Spinning tops identify a session in which there is little price action (as defined by the difference between the open and the close). During a rally or near new highs, a spinning top can be a sign that prices are losing momentum and the bulls may be in trouble.
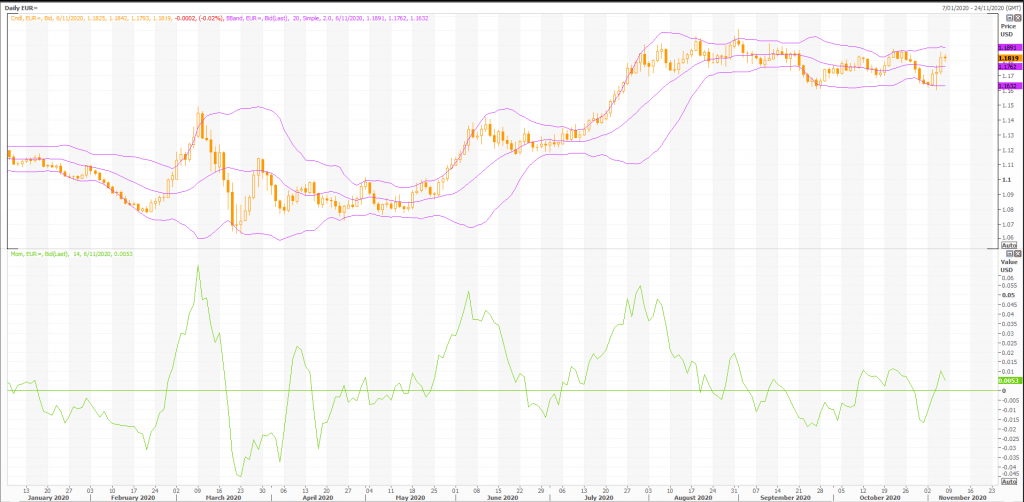
Momentum Indicators
Momentum is a general term used to describe the speed at which prices move over a given time period. Generally, changes in momentum tend to lead to changes in prices. This expert shows the current values of four popular momentum indicators.
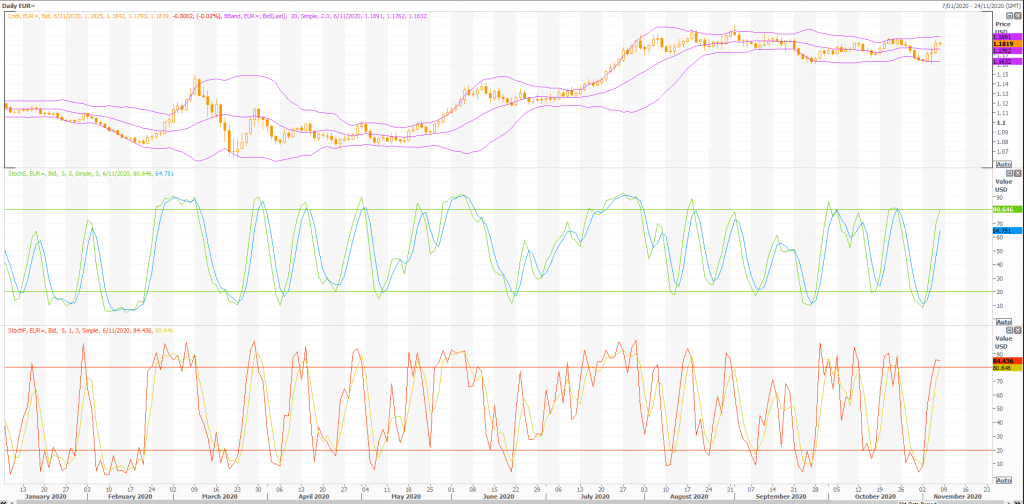
Stochastic Oscillator
One method of interpreting the Stochastic Oscillator is looking for overbought areas (above 80) and oversold areas (below 20). The Stochastic Oscillator is 81.4707. This is an overbought reading. However, a signal is not generated until the Oscillator crosses below 80 The last signal was a buy 2 period(s) ago.
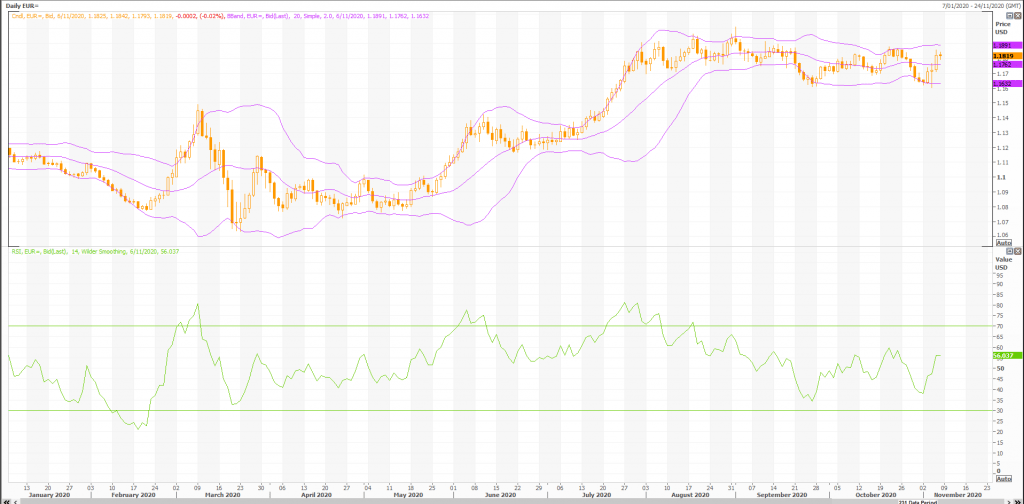
Relative Strength Index (RSI)
The RSI shows overbought (above 70) and oversold (below 30) areas. The current value of the RSI is 55.83. This is not a topping or bottoming area. A buy or sell signal is generated when the RSI moves out of an overbought/oversold area. The last signal was a sell 57 period(s) ago.
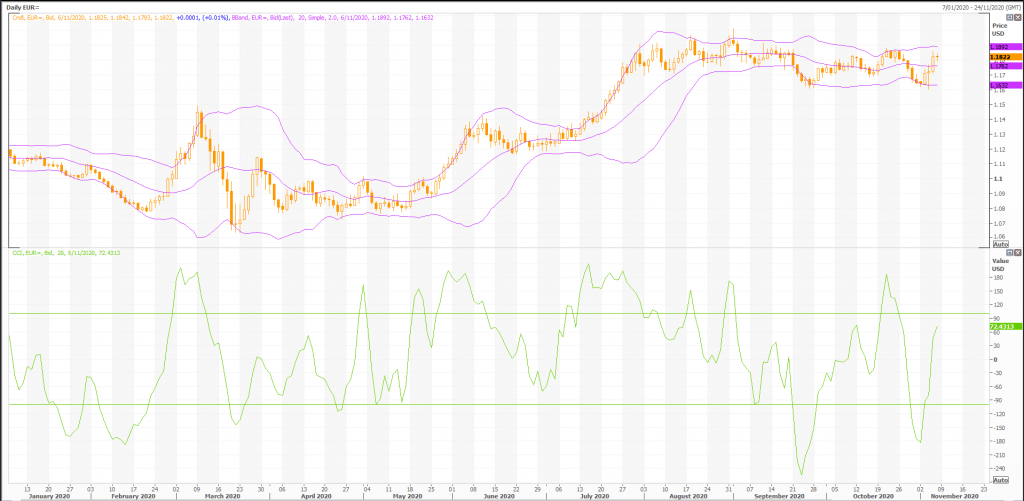
Commodity Channel Index (CCI)
The CCI shows overbought (above 100) and oversold (below -100) areas. The current value of the CCI is 54. This is not a topping or bottoming area. The last signal was a buy 3 period(s) ago.
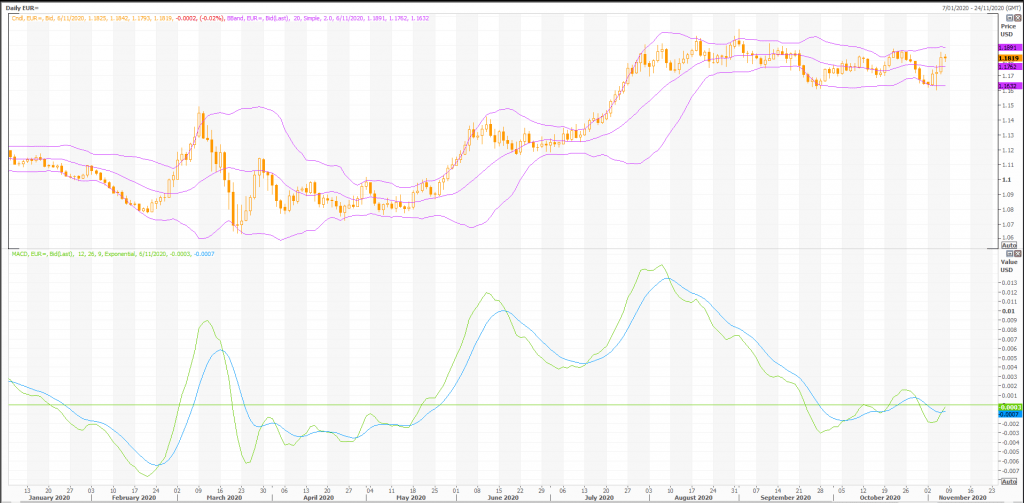
MACD
The Moving Average Convergence/Divergence indicator (MACD) gives signals when it crosses its 9 period signal line. The last signal was a buy 0 period(s) ago.
Rex Takasugi – TD Profile
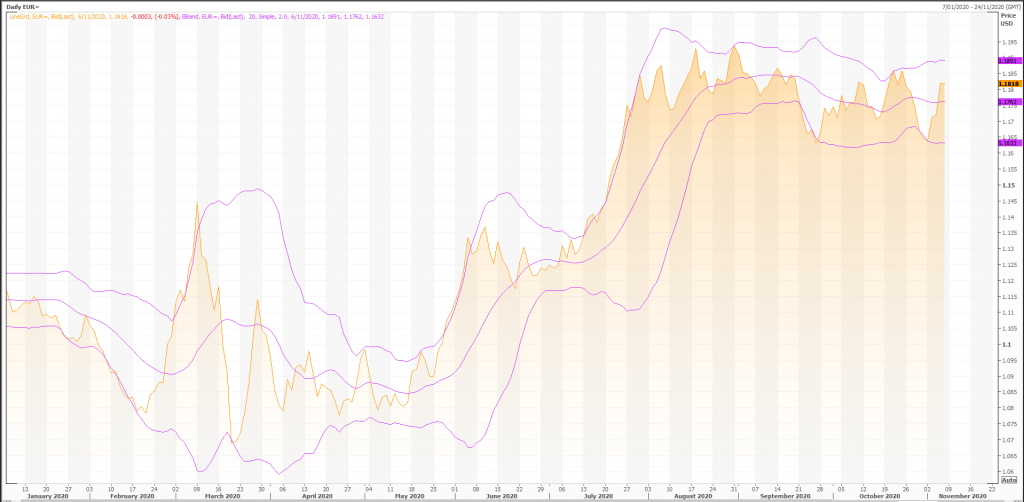
FOREX EUR= closed down -0.000 at 1.182. Volume was 69% below average (consolidating) and Bollinger Bands were 16% narrower than normal.
Open High Low Close Volume 1.183 1.184 1.179 1.182 31,386 Technical Outlook Short Term: Neutral Intermediate Term: Bullish Long Term: Bullish Moving Averages: 10-period 50-period 200-period Close: 1.17 1.18 1.13 Volatility: 8 7 10 Volume: 102,410 101,776 107,266
Short-term traders should pay closer attention to buy/sell arrows while intermediate/long-term traders should place greater emphasis on the Bullish or Bearish trend reflected in the lower ribbon.
Summary
FOREX EUR= is currently 4.3% above its 200-period moving average and is in an upward trend. Volatility is high as compared to the average volatility over the last 10 periods.
Our volume indicators reflect volume flowing into and out of EUR= at a relatively equal pace (neutral). Our trend forecasting oscillators are currently bullish on EUR= and have had this outlook for the last 0 periods.