
Metastock Terminal Data on Strong JPY and Weak USD Means Sell USD/JPY (JPY=X) – Live Trading News
Japanese Yen Outlook
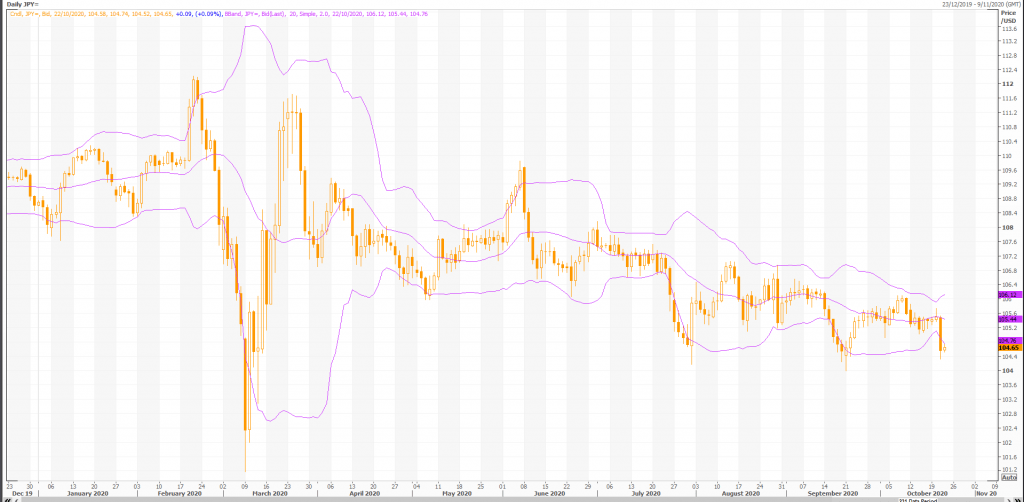
Forex traders seem to be content in assuming that there is going to be stimulus coming out of the United States. This is showing up in the USD/JPY pair during the trading session on Wednesday, as we have seen the market break below the ¥105 level rather early in the day.
That being said, the market looks as if it is ready to continue drifting towards the lows, something that I have been talking about for a while.
To the downside, I believe that the ¥104 level is probably the next target, as it has caused a bounce the last couple of times we have been down there. Breaking through their opens up the possibility of a move down to the ¥102 level, which was an even more important support level in the past. That being said, I would not expect to move much lower than that before the Bank of Japan will start to take action.
USD/JPY Dollar Exchange Rate
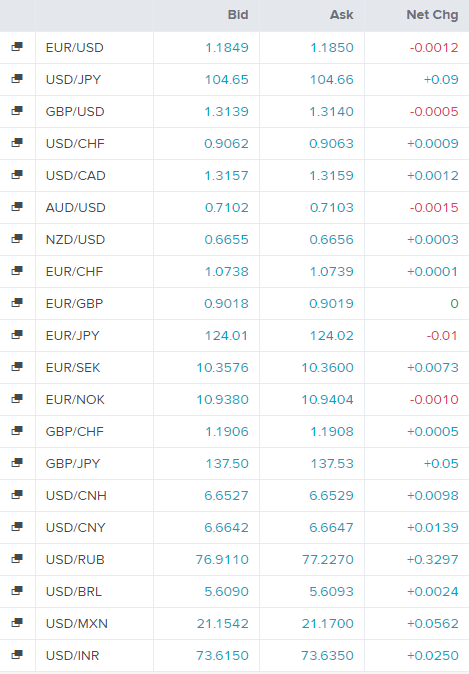
Today’s Forex Rates
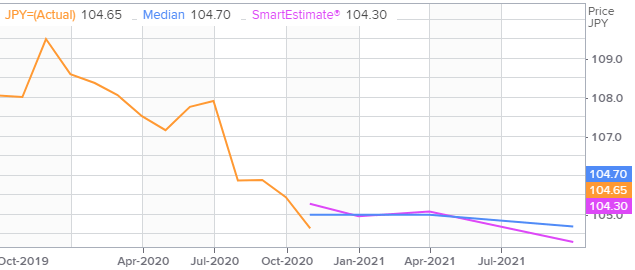
USD/JPY Dollar FX Polls
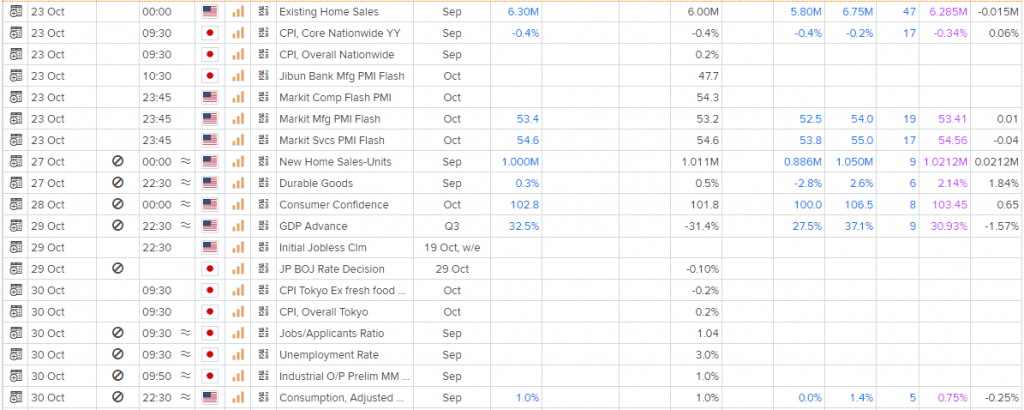
Economic Events
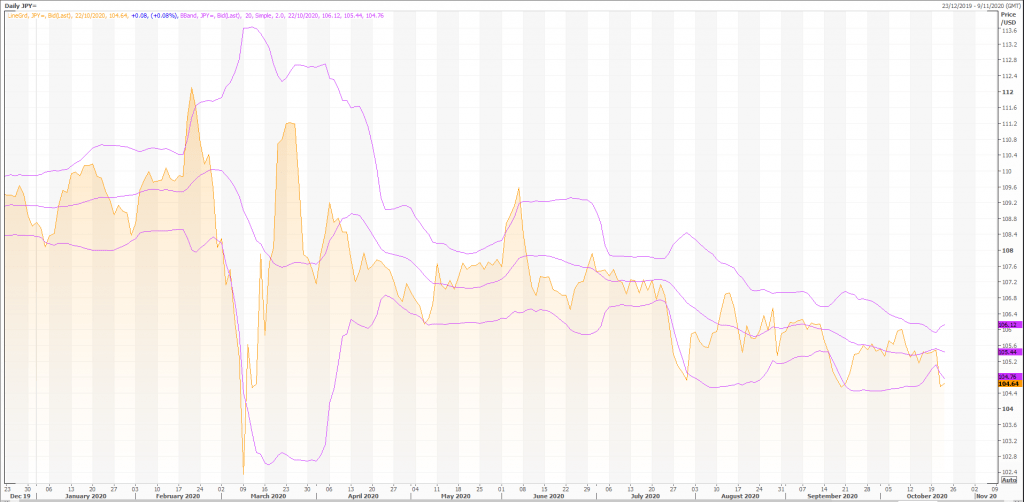
Technical Indicators
Overall, the bias in prices is: Downwards.
The projected upper bound is: 105.69.
The projected lower bound is: 103.54.
The projected closing price is: 104.61.
Candlesticks
A white body occurred (because prices closed higher than they opened).
During the past 10 bars, there have been 5 white candles and 5 black candles. During the past 50 bars, there have been 26 white candles and 24 black candles for a net of 2 white candles.
Momentum Indicators
Momentum is a general term used to describe the speed at which prices move over a given time period. Generally, changes in momentum tend to lead to changes in prices. This expert shows the current values of four popular momentum indicators.
Stochastic Oscillator
One method of interpreting the Stochastic Oscillator is looking for overbought areas (above 80) and oversold areas (below 20). The Stochastic Oscillator is 29.4945. This is not an overbought or oversold reading. The last signal was a buy 5 period(s) ago.

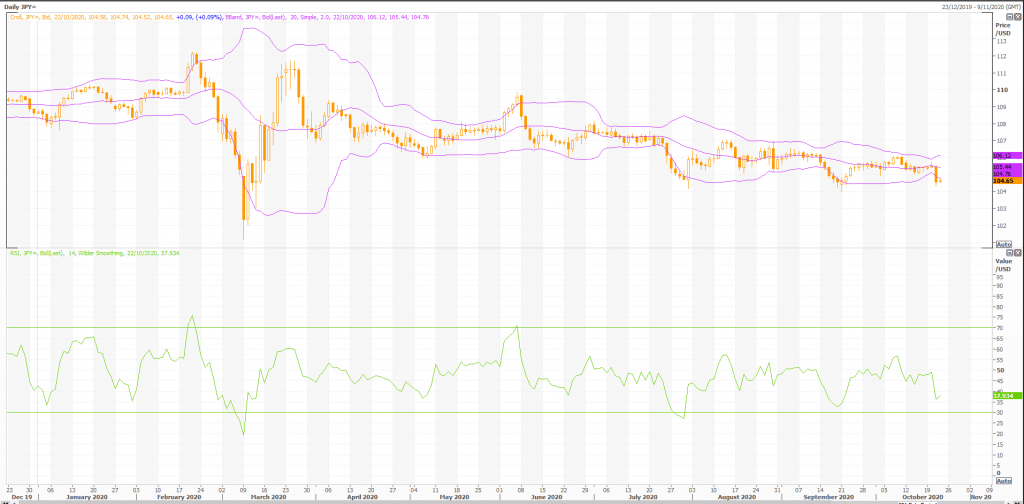
Relative Strength Index (RSI)
The RSI shows overbought (above 70) and oversold (below 30) areas. The current value of the RSI is 38.12. This is not a topping or bottoming area. A buy or sell signal is generated when the RSI moves out of an overbought/oversold area. The last signal was a buy 59 period(s) ago.
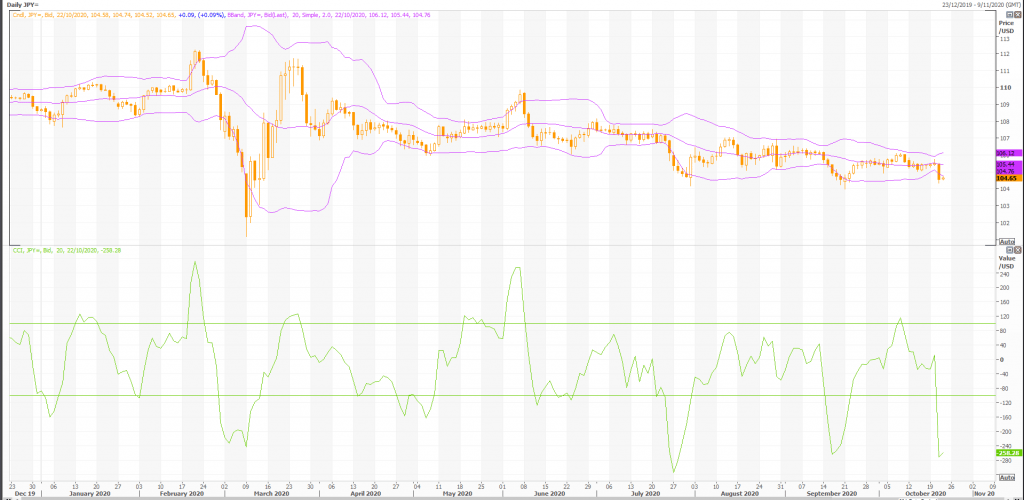
Commodity Channel Index (CCI)
The CCI shows overbought (above 100) and oversold (below -100) areas. The current value of the CCI is -200.This is an oversold reading. However, a signal isn’t generated until the indicator crosses above -100. The last signal was a buy 5 period(s) ago.
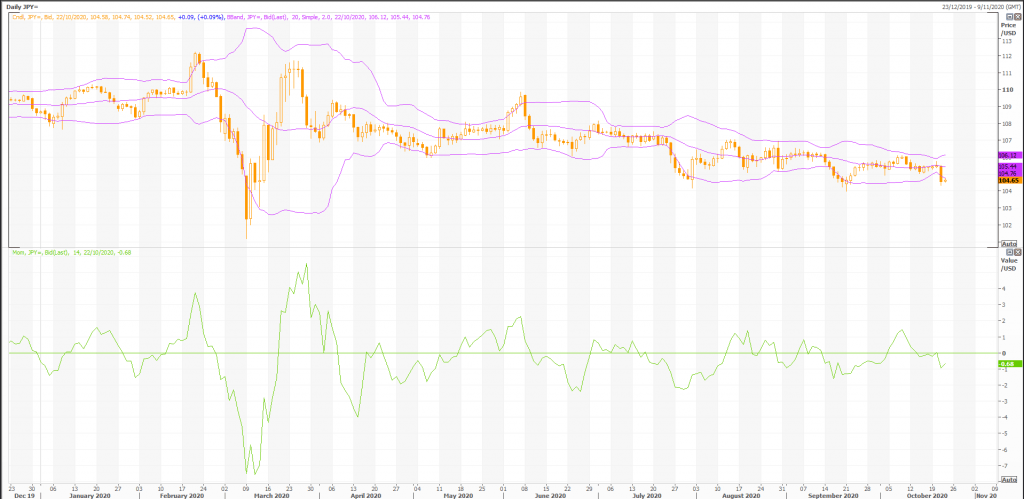
MACD
The Moving Average Convergence/Divergence indicator (MACD) gives signals when it crosses its 9 period signal line. The last signal was a sell 6 period(s) ago.
Rex Takasugi – TD Profile
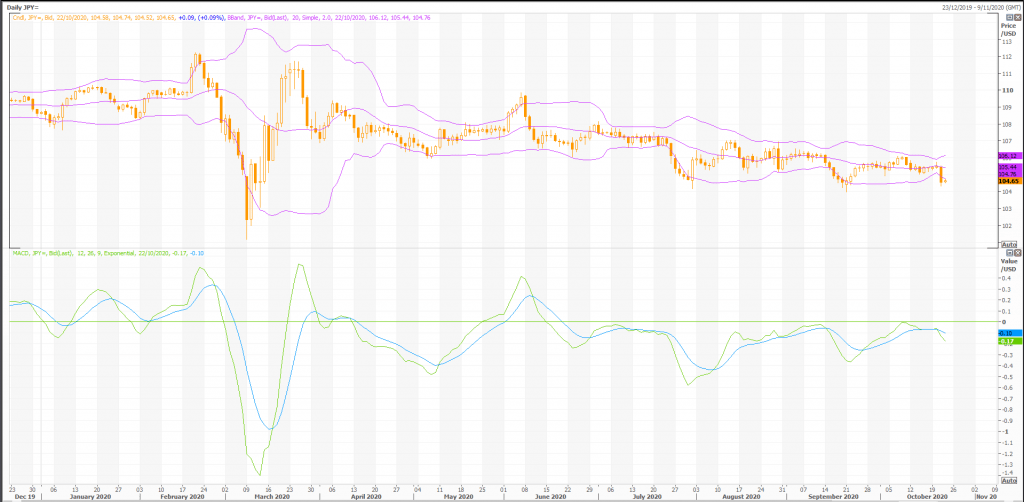
FOREX JPY= closed up 0.100 at 104.660. Volume was 59% below average (consolidating) and Bollinger Bands were 35% narrower than normal.
Open High Low Close Volume 104.580 104.740 104.520 104.660 39,871 Technical Outlook Short Term: Neutral Intermediate Term: Bearish Long Term: Bearish Moving Averages: 10-period 50-period 200-period Close: 105.25 105.63 107.26 Volatility: 6 7 12 Volume: 88,036 96,903 110,798
Short-term traders should pay closer attention to buy/sell arrows while intermediate/long-term traders should place greater emphasis on the Bullish or Bearish trend reflected in the lower ribbon.
Summary
FOREX JPY= is currently 2.4% below its 200-period moving average and is in an downward trend. Volatility is extremely high when compared to the average volatility over the last 10 periods. There is a good possibility that volatility will decrease and prices will stabilize in the near term.
Our volume indicators reflect volume flowing into and out of JPY= at a relatively equal pace (neutral). Our trend forecasting oscillators are currently bearish on JPY= and have had this outlook for the last 5 periods.