
Live Trading Technicals and Charts for British Pound: GBP/USD (GBP=X) by HEFFX – Live Trading News
British Pound Outlook
The hourly chart below shows that the GBPUSD price has fallen in the past six consecutive hours. At the current price of 1.3026, the price is at the lowest level since Wednesday last week. The price is also along the lower line of the Donchian channel. The price has also dropped below the second support level of the Andrews Pitchfork.
Therefore, expect the downward pressure to continue today as bears aim for the next psychological support level at 1.3000. A break below this support will see it drop to 1.2990. On the flip side, a move above the Friday’s high of 1.3065 will invalidate this trend.
GBP/US Dollar Exchange Rate
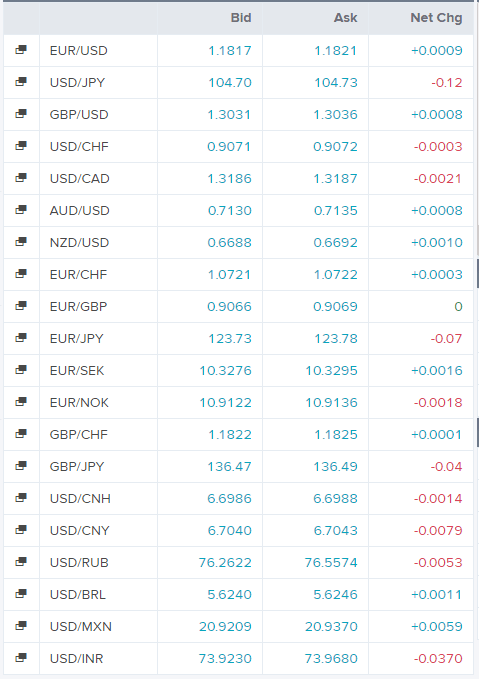
Today’s Forex Rates
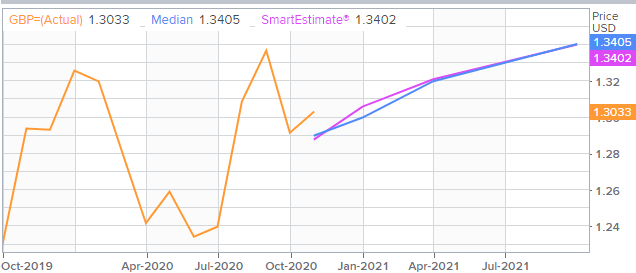
GBP/US Dollar FX Polls
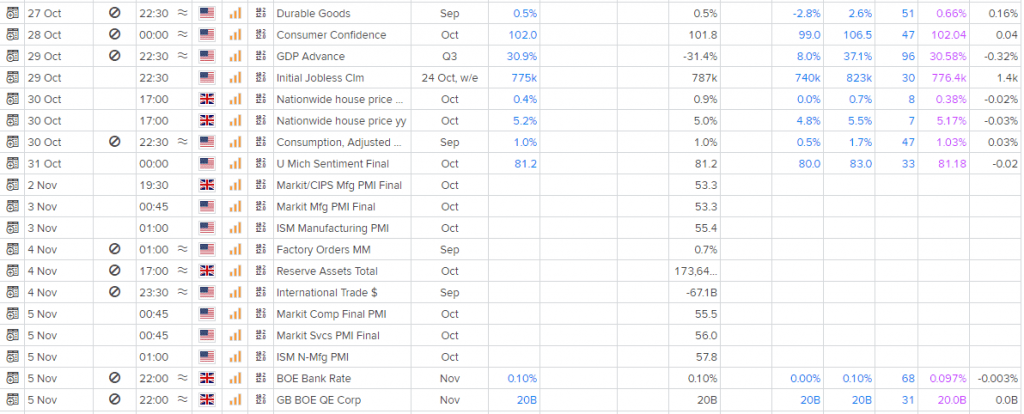
Economic Events
Technical Indicators
Overall, the bias in prices is: Sideways.
The projected upper bound is: 1.33.
The projected lower bound is: 1.28.
The projected closing price is: 1.30.
Candlesticks
A white body occurred (because prices closed higher than they opened).
During the past 10 bars, there have been 4 white candles and 6 black candles for a net of 2 black candles. During the past 50 bars, there have been 26 white candles and 24 black candles for a net of 2 white candles.
A spinning top occurred (a spinning top is a candle with a small real body). Spinning tops identify a session in which there is little price action (as defined by the difference between the open and the close). During a rally or near new highs, a spinning top can be a sign that prices are losing momentum and the bulls may be in trouble.
Momentum Indicators
Momentum is a general term used to describe the speed at which prices move over a given time period. Generally, changes in momentum tend to lead to changes in prices. This expert shows the current values of four popular momentum indicators.
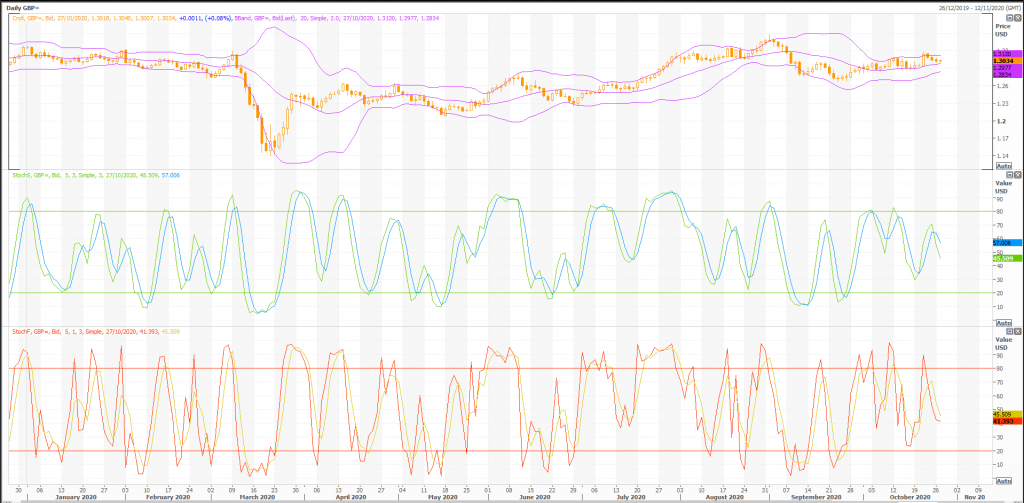
Stochastic Oscillator
One method of interpreting the Stochastic Oscillator is looking for overbought areas (above 80) and oversold areas (below 20). The Stochastic Oscillator is 45.6928. This is not an overbought or oversold reading. The last signal was a sell 10 period(s) ago.
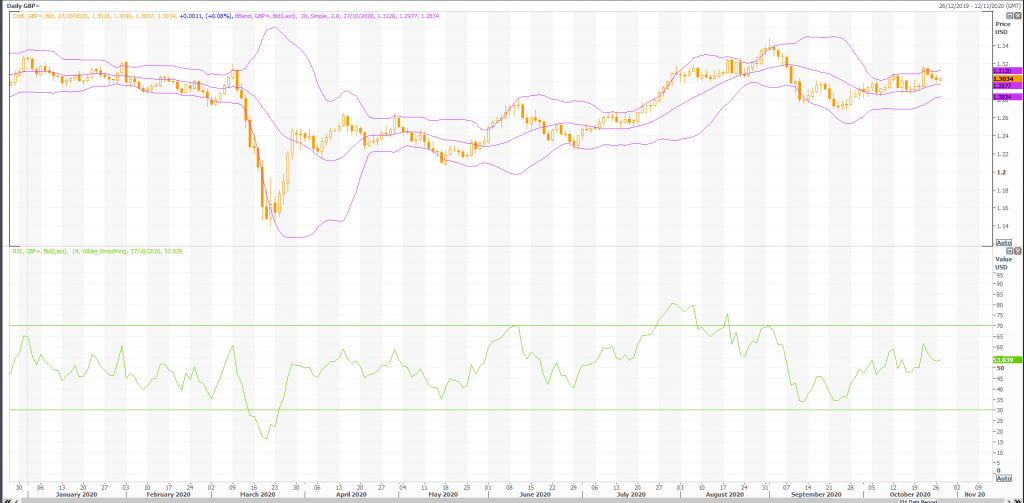
Relative Strength Index (RSI)
The RSI shows overbought (above 70) and oversold (below 30) areas. The current value of the RSI is 53.78. This is not a topping or bottoming area. A buy or sell signal is generated when the RSI moves out of an overbought/oversold area. The last signal was a sell 49 period(s) ago.
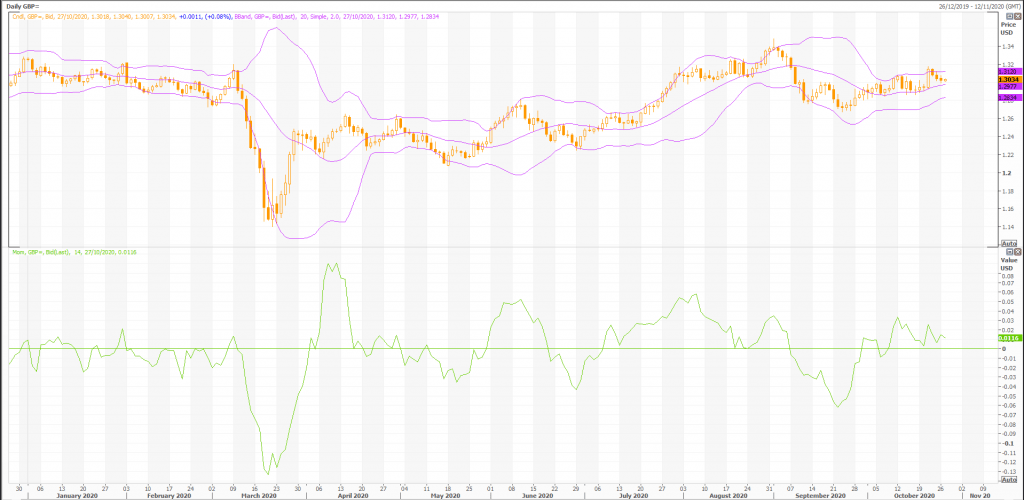
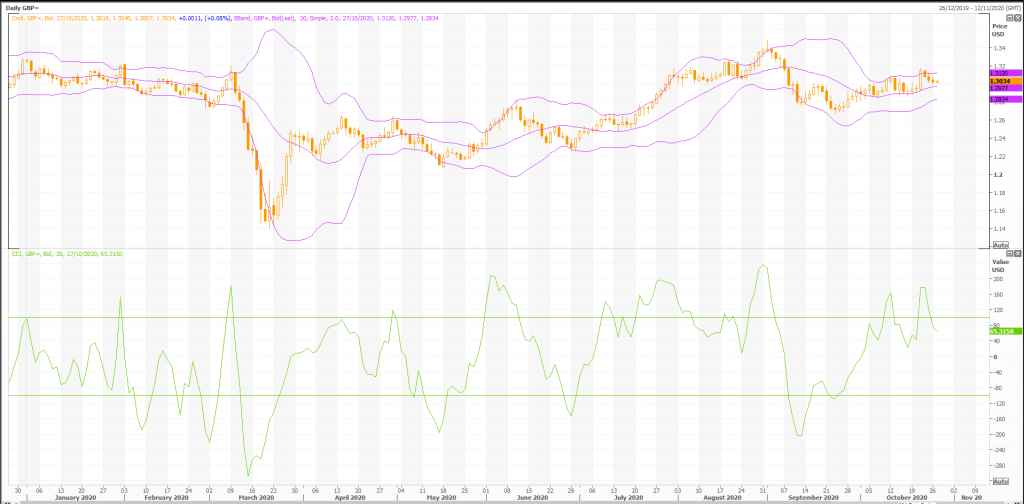
Commodity Channel Index (CCI)
The CCI shows overbought (above 100) and oversold (below -100) areas. The current value of the CCI is 35. This is not a topping or bottoming area. The last signal was a sell 2 period(s) ago.
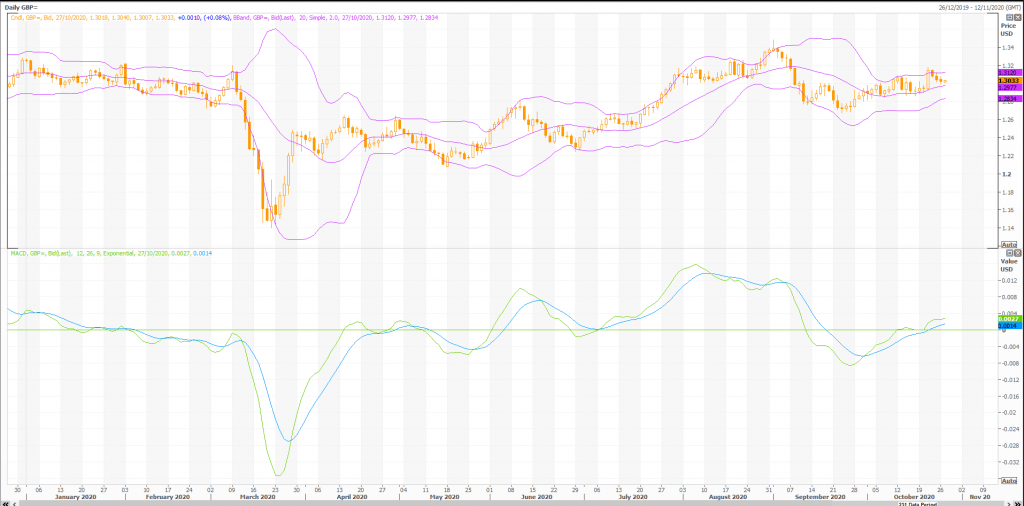
MACD
The Moving Average Convergence/Divergence indicator (MACD) gives signals when it crosses its 9 period signal line. The last signal was a buy 19 period(s) ago.
Rex Takasugi – TD Profile
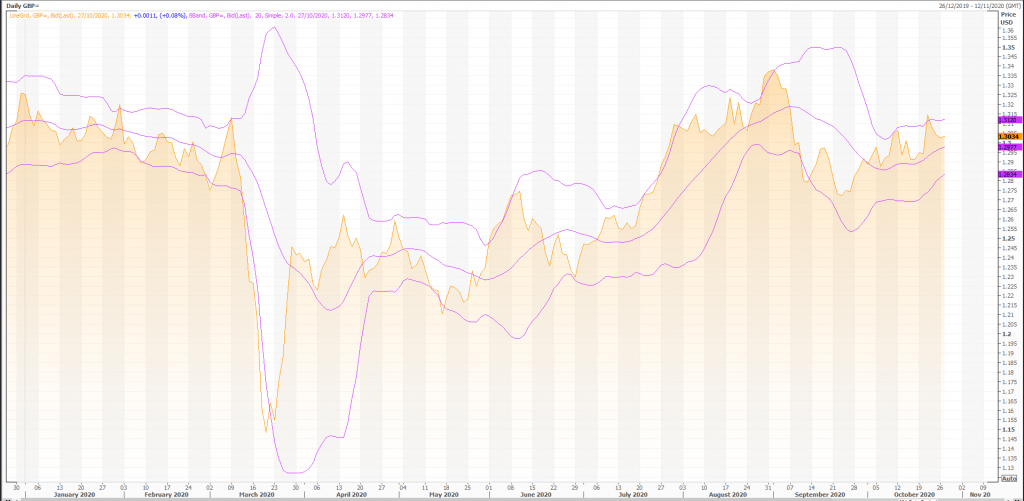
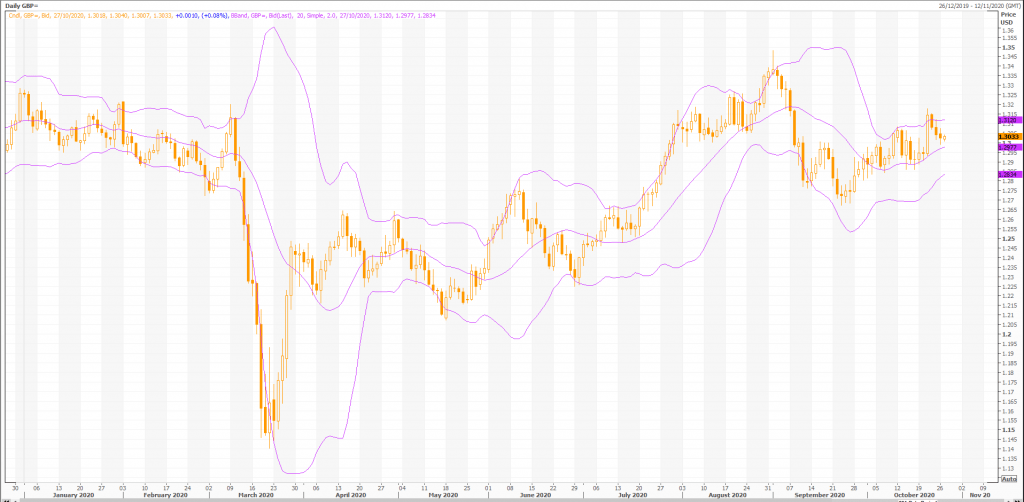
FOREX GBP= closed up 0.001 at 1.303. Volume was 79% below average (consolidating) and Bollinger Bands were 45% narrower than normal.
Open High Low Close Volume 1.302 1.304 1.301 1.303 27,101 Technical Outlook Short Term: Neutral Intermediate Term: Bullish Long Term: Bullish Moving Averages: 10-period 50-period 200-period Close: 1.30 1.30 1.27 Volatility: 12 12 14 Volume: 129,482 135,515 128,460
Short-term traders should pay closer attention to buy/sell arrows while intermediate/long-term traders should place greater emphasis on the Bullish or Bearish trend reflected in the lower ribbon.
Summary
FOREX GBP= is currently 2.6% above its 200-period moving average and is in an upward trend. Volatility is high as compared to the average volatility over the last 10 periods.
Our volume indicators reflect volume flowing into and out of GBP= at a relatively equal pace (neutral). Our trend forecasting oscillators are currently bullish on GBP= and have had this outlook for the last 9 periods.