
Facebook (NASDAQ:FB) Stock Chart Technical Analysis from Metastock – Live Trading News
$FB #Facebook #SocialMedia #Nasdaq #Stocks #Trading #Metastock
Facebook
Ticker: NASDAQ:FB
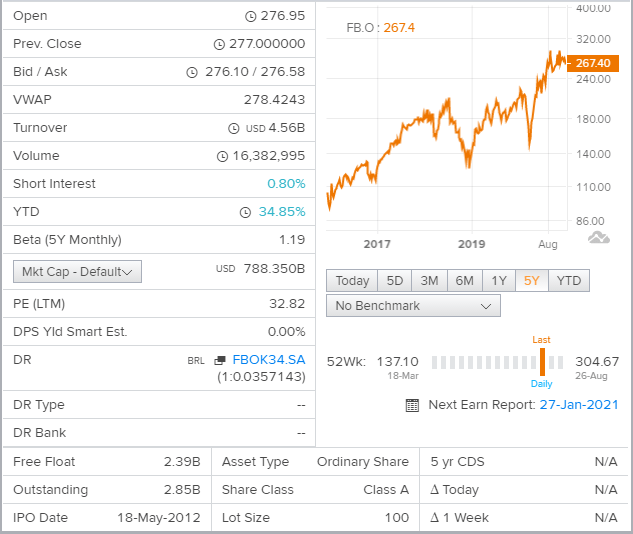
Price: $276.78
Facebook News
Facebook (FB) closed the most recent trading day at $276.78, moving -0.08% from the previous trading session. This change was narrower than the S&P 500’s 0.22% loss on the day. Meanwhile, the Dow lost 0.23%, and the Nasdaq, a tech-heavy index, lost 0.38%.
Prior to today’s trading, shares of the social media company had gained 0.01% over the past month. This has lagged the Computer and Technology sector’s gain of 5.2% and the S&P 500’s gain of 2.78% in that time.
Investors will be hoping for strength from FB as it approaches its next earnings release. In that report, analysts expect FB to post earnings of $3.20 per share. This would mark year-over-year growth of 25%. Our most recent consensus estimate is calling for quarterly revenue of $26.23 billion, up 24.43% from the year-ago period.
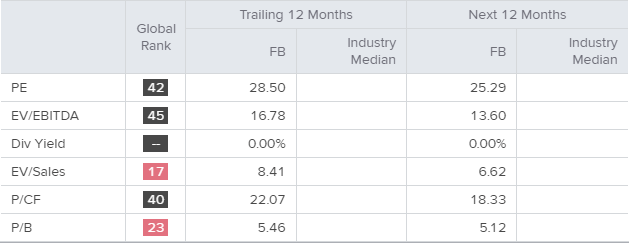
In terms of valuation, FB is currently trading at a Forward P/E ratio of 29.5. For comparison, its industry has an average Forward P/E of 29.5, which means FB is trading at a no noticeable deviation to the group.
We can also see that FB currently has a PEG ratio of 1.6. The PEG ratio is similar to the widely-used P/E ratio, but this metric also takes the company’s expected earnings growth rate into account. The Internet – Services industry currently had an average PEG ratio of 2.02 as of yesterday’s close.
Business Summary
Facebook continues to confront election rated censorship controversies. However, it remains a staple in technology and a blue-chip stock with enticing upside.
Our AI systems rated Facebook C in Technicals, B in Growth, B in Low Volatility Momentum, and B in Quality Value. The stock closed down 6.31% to $263.11 on volume of 47,299,002 vs its 10-day price average of $274.26 and its 22-day price average of $269.78, and is up 25.42% for the year.
Revenue grew by 11.71% in the last fiscal year and grew by 94.27% over the last three fiscal years, Operating Income grew by 19.88% in the last fiscal year and grew by 42.33% over the last three fiscal years, EPS grew by 36.52% in the last fiscal year and grew by 62.85% over the last three fiscal years.
Revenue was $70697.0M in the last fiscal year compared to $40653.0M three years ago, Operating Income was $23986.0M in the last fiscal year compared to $20203.0M three years ago, EPS was $6.43 in the last fiscal year compared to $5.39 three years ago, and ROE was 19.96% in the last year compared to 23.86% three years ago.
Forward 12M Revenue is expected to grow by 16.71% over the next 12 months, and the stock is trading with a Forward 12M P/E of 26.3.
Price Performance
Relative Valuation
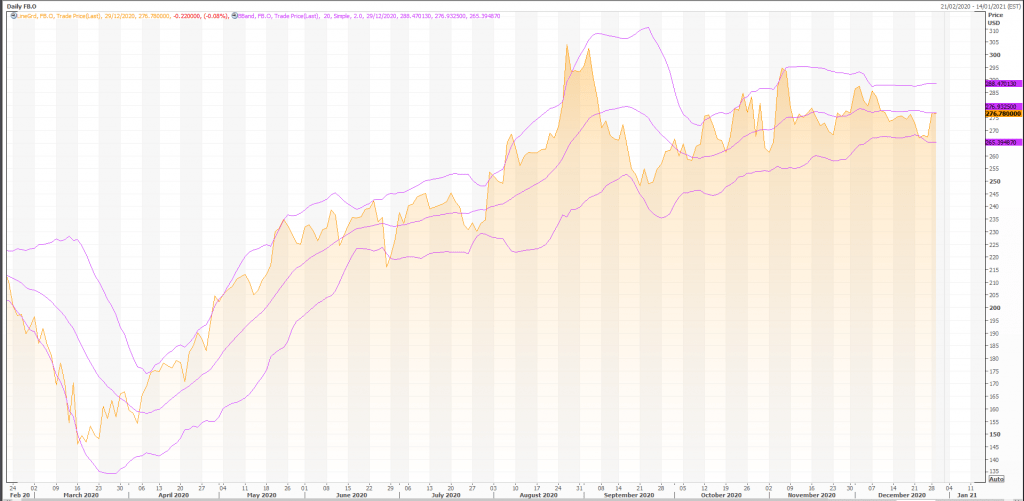
Technical Indicators
Overall, the bias in prices is: Upwards.
The projected upper bound is: 297.66.
The projected lower bound is: 256.33.
The projected closing price is: 277.00.
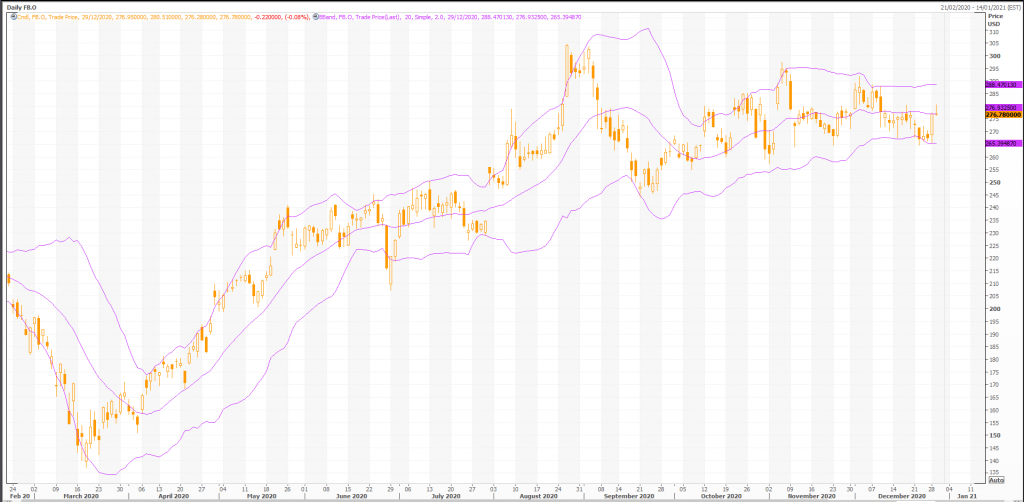
Candlesticks
A black body occurred (because prices closed lower than they opened).
During the past 10 bars, there have been 5 white candles and 5 black candles. During the past 50 bars, there have been 23 white candles and 27 black candles for a net of 4 black candles.
A bearish harami occurred (where the current small black body is contained within an unusually large white body). During an uptrend (which appears to be the case with FACEBOOK INC A) this pattern implies an end to the rally as the bulls appear to have exhausted themselves.
During a downtrend the bearish harami pattern is bullish as the bulls appear to be gaining strength as the bears weaken.
A long upper shadow occurred. This is typically a bearish signal (particularly when it occurs near a high price level, at resistance level, or when the security is overbought).
A spinning top occurred (a spinning top is a candle with a small real body). Spinning tops identify a session in which there is little price action (as defined by the difference between the open and the close). During a rally or near new highs, a spinning top can be a sign that prices are losing momentum and the bulls may be in trouble.
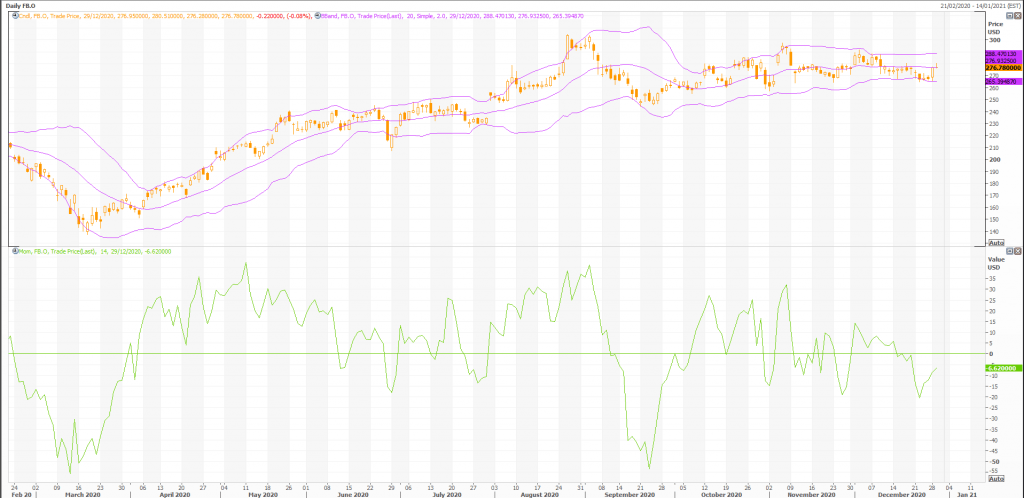
Momentum Indicators
Momentum is a general term used to describe the speed at which prices move over a given time period. Generally, changes in momentum tend to lead to changes in prices. This expert shows the current values of four popular momentum indicators.
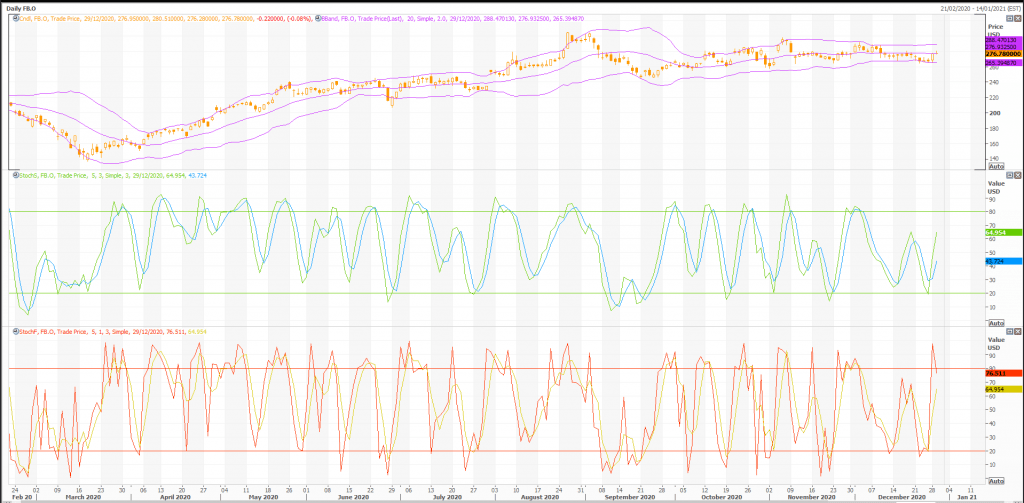
Stochastic Oscillator
One method of interpreting the Stochastic Oscillator is looking for overbought areas (above 80) and oversold areas (below 20). The Stochastic Oscillator is 65.1002. This is not an overbought or oversold reading. The last signal was a buy 1 period(s) ago.
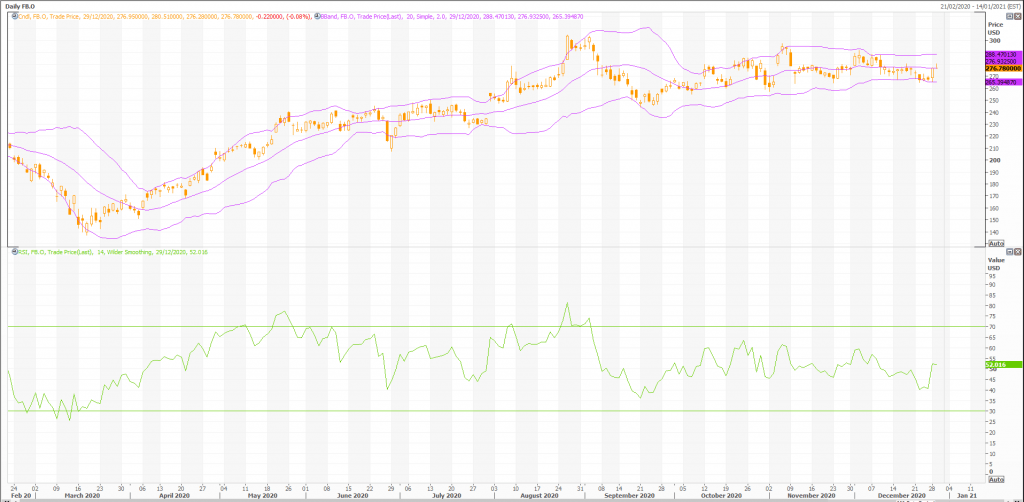
Relative Strength Index (RSI)
The RSI shows overbought (above 70) and oversold (below 30) areas. The current value of the RSI is 52.02. This is not a topping or bottoming area. A buy or sell signal is generated when the RSI moves out of an overbought/oversold area. The last signal was a sell 80 period(s) ago.
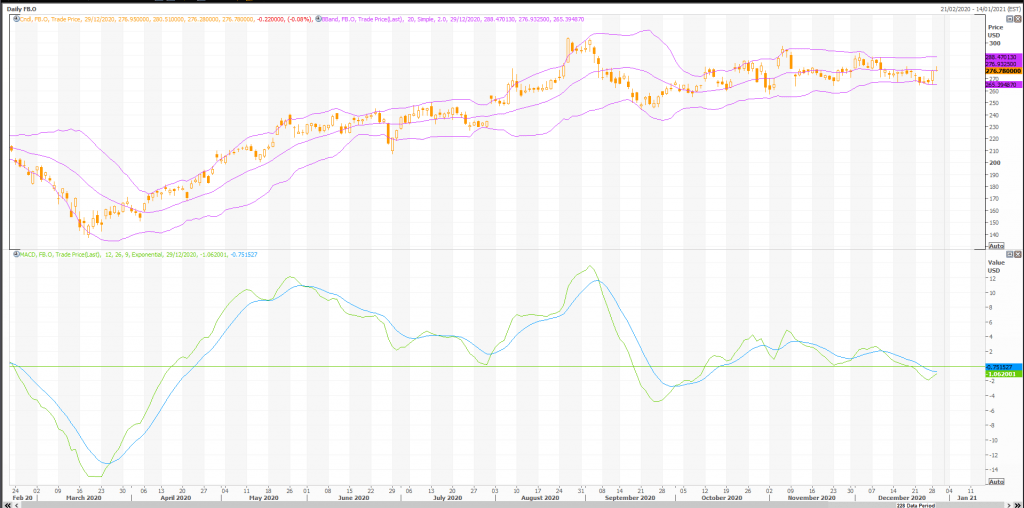
MACD
The Moving Average Convergence/Divergence indicator (MACD) gives signals when it crosses its 9 period signal line. The last signal was a sell 12 period(s) ago.
Rex Takasugi – TD Profile
FACEBOOK INC A closed down -0.220 at 276.780. Volume was 21% below average (neutral) and Bollinger Bands were 41% narrower than normal.
Open High Low Close Volume 276.950 280.510 276.280 276.780 16,382,995 Technical Outlook Short Term: Neutral Intermediate Term: Bearish Long Term: Bullish Moving Averages: 10-period 50-period 200-period Close: 273.13 276.15 241.88 Volatility: 27 48 50 Volume: 17,753,806 18,641,278 23,389,828
Short-term traders should pay closer attention to buy/sell arrows while intermediate/long-term traders should place greater emphasis on the Bullish or Bearish trend reflected in the lower ribbon.
Summary
FACEBOOK INC A is currently 14.4% above its 200-period moving average and is in an downward trend. Volatility is Our volume indicators reflect volume flowing into and out of FB.O at a relatively equal pace (neutral).
Our trend forecasting oscillators are currently bearish on FB.O and have had this outlook for the last 11 periods.