
Euro: EUR/USD (EUR=X) Trading For Profit With HEFFX – Live Trading News
Euro News
The dollar retreated broadly in the face of improving risk sentiment, with sterling scoring the biggest gains among the majors, but a heavy slate of event risk including U.S. presidential debates and non-farm payrolls lies ahead.
It remained to be seen whether the slide in the U.S. currency was mostly month- and quarter-end position-squaring or a more enduring resumption of asset reflation funded by dollar sales.
For a broad guide to the dollar, traders will be watching stocks for a potential resumption of the uptrend from March in the S&P 500, particularly with a close above the 50-day moving average. Similarly, the DAX needs to close back above its 55-DMA at 12,908.
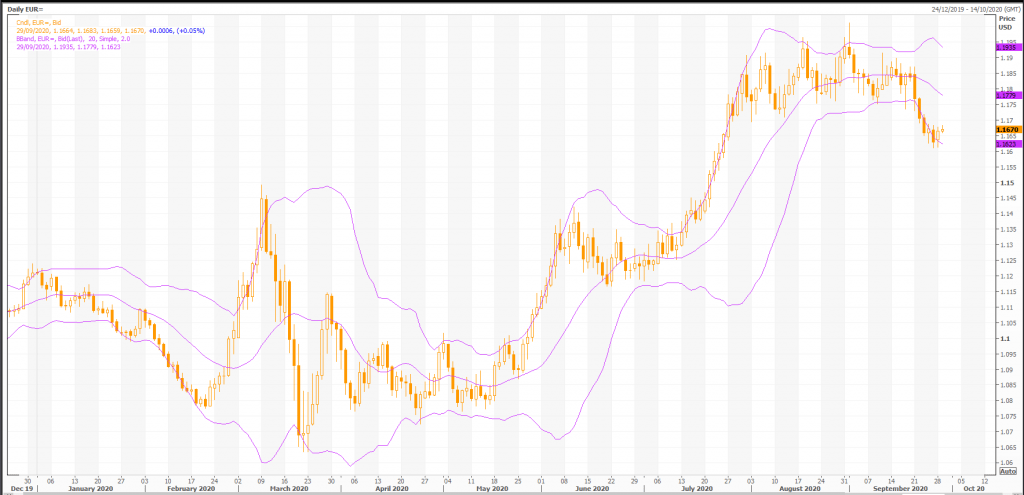
EUR/USD held above Friday’s September low at 1.16125 on EBS, the STOX600 index posted its biggest gain since June, but the euro stalled ahead of Friday’s 1.1685 high.
The euro tumbled to the 50% Fibo of September’s rise versus the pound at 0.9028 before rebounding toward the 38.2% Fibo at 0.9078 by the Sept. 17 swing low at 0.9084.
The rebounding dollar index has been unable to close above its downtrend from March’s high and would be threatened by a broader stocks recovery.
Euro/US Dollar Exchange Rate
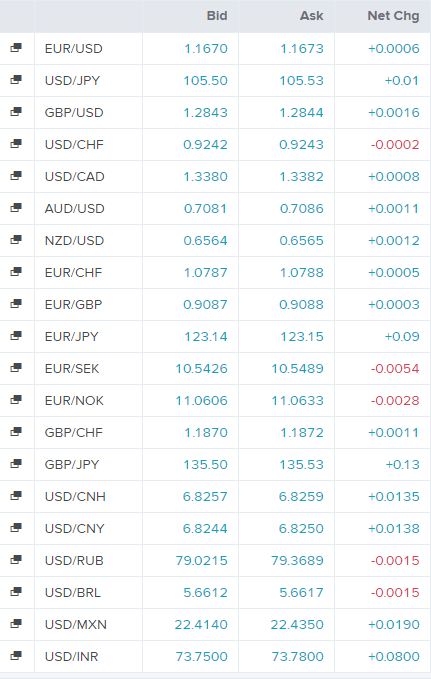
Today’s Forex Rates
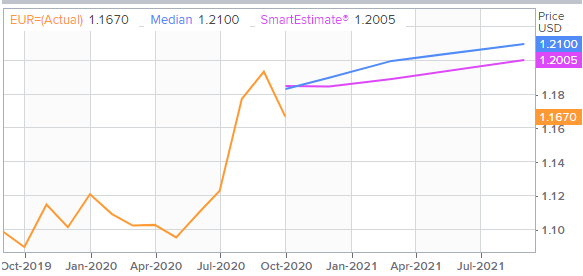
EUR/USD FX Polls
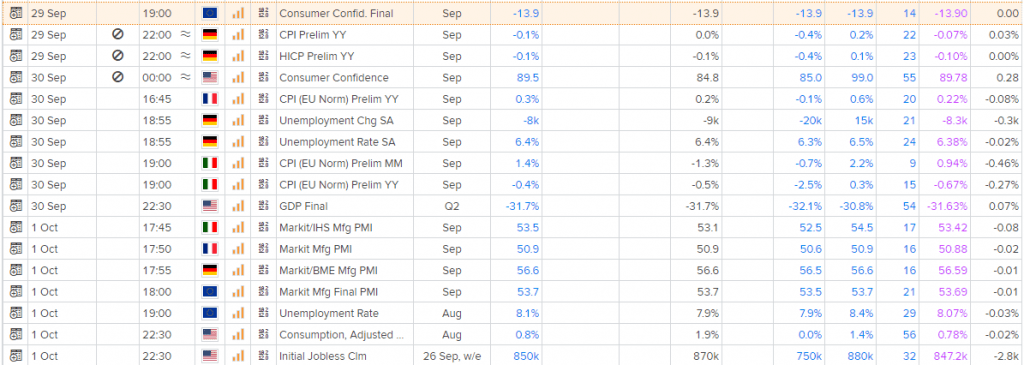
Economic Events
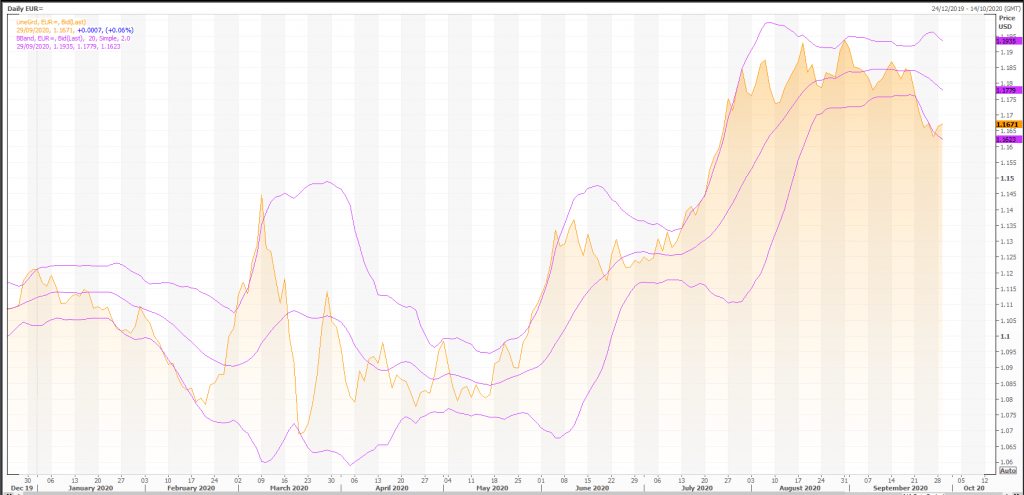
Technical Indicators
Overall, the bias in prices is: Sideways.
The projected upper bound is: 1.18.
The projected lower bound is: 1.15.
The projected closing price is: 1.17.
Candlesticks
A white body occurred (because prices closed higher than they opened).
During the past 10 bars, there have been 4 white candles and 6 black candles for a net of 2 black candles. During the past 50 bars, there have been 28 white candles and 22 black candles for a net of 6 white candles.
A spinning top occurred (a spinning top is a candle with a small real body). Spinning tops identify a session in which there is little price action (as defined by the difference between the open and the close). During a rally or near new highs, a spinning top can be a sign that prices are losing momentum and the bulls may be in trouble.
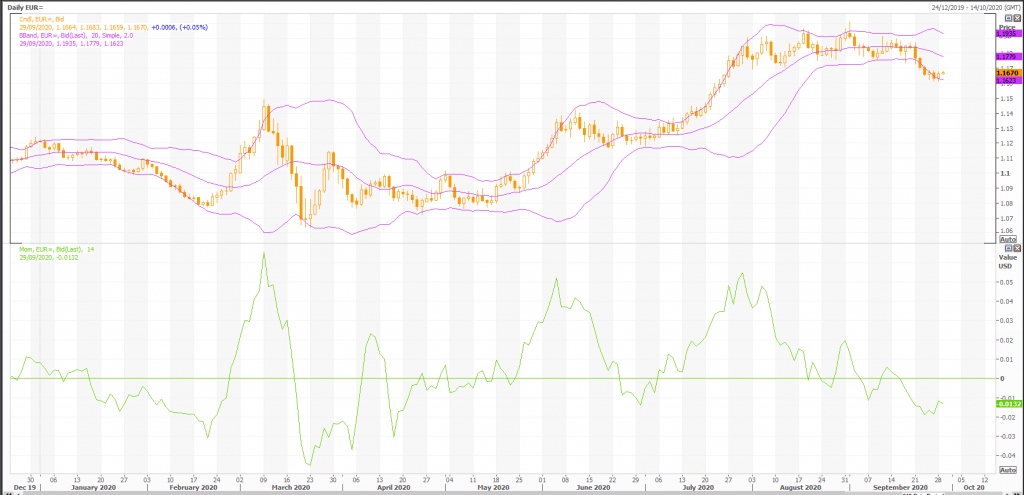
Momentum Indicators
Momentum is a general term used to describe the speed at which prices move over a given time period. Generally, changes in momentum tend to lead to changes in prices. This expert shows the current values of four popular momentum indicators.
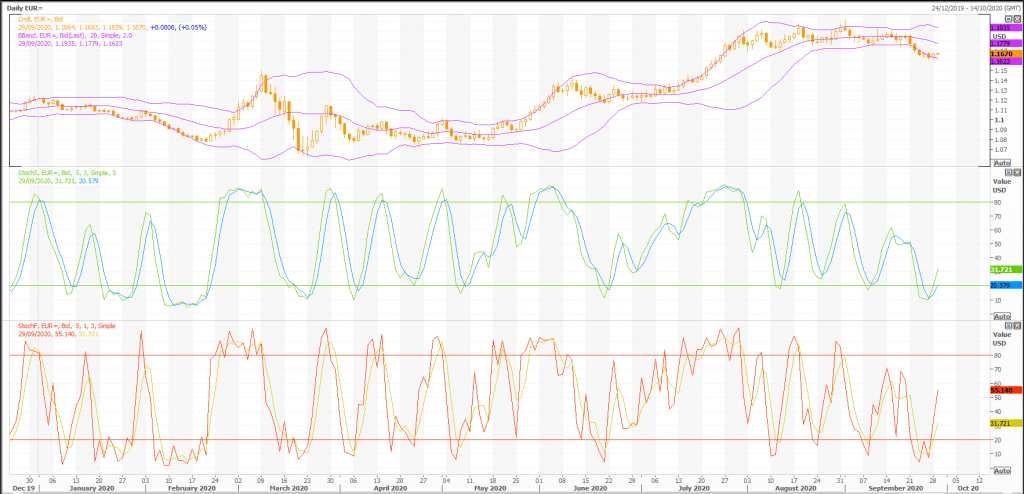
Stochastic Oscillator
One method of interpreting the Stochastic Oscillator is looking for overbought areas (above 80) and oversold areas (below 20). The Stochastic Oscillator is 24.5745. This is not an overbought or oversold reading. The last signal was a buy 0 period(s) ago.
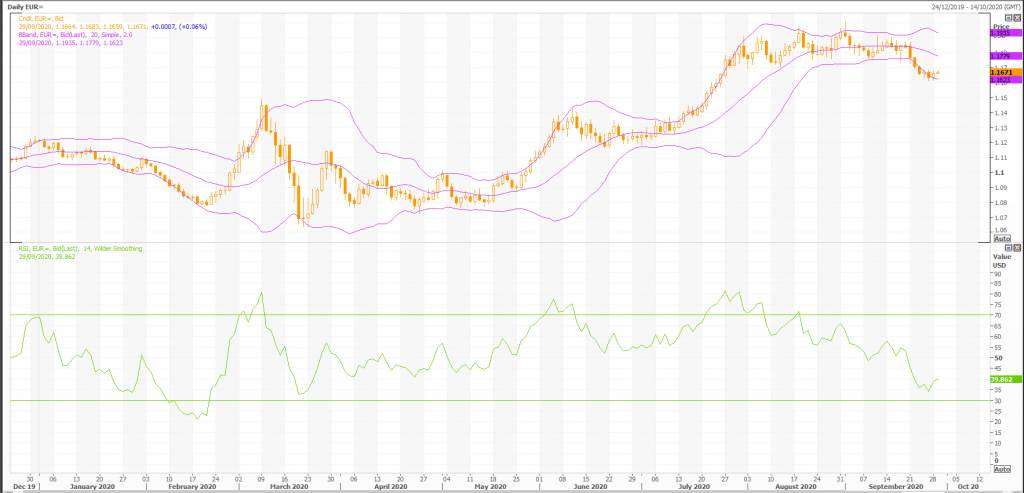
Relative Strength Index (RSI)
The RSI shows overbought (above 70) and oversold (below 30) areas. The current value of the RSI is 39.60. This is not a topping or bottoming area. A buy or sell signal is generated when the RSI moves out of an overbought/oversold area. The last signal was a sell 29 period(s) ago.
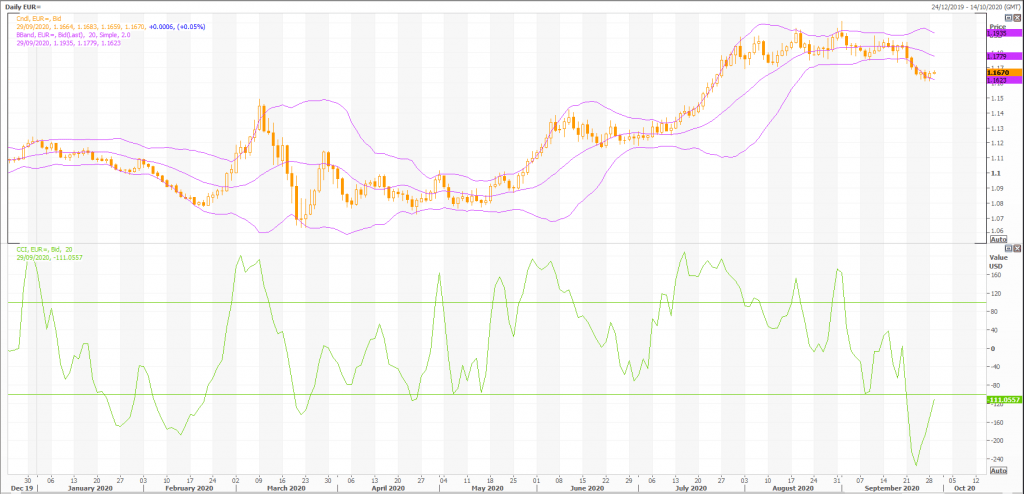
Commodity Channel Index (CCI)
The CCI shows overbought (above 100) and oversold (below -100) areas. The current value of the CCI is -78. This is not a topping or bottoming area. The last signal was a buy 0 period(s) ago.
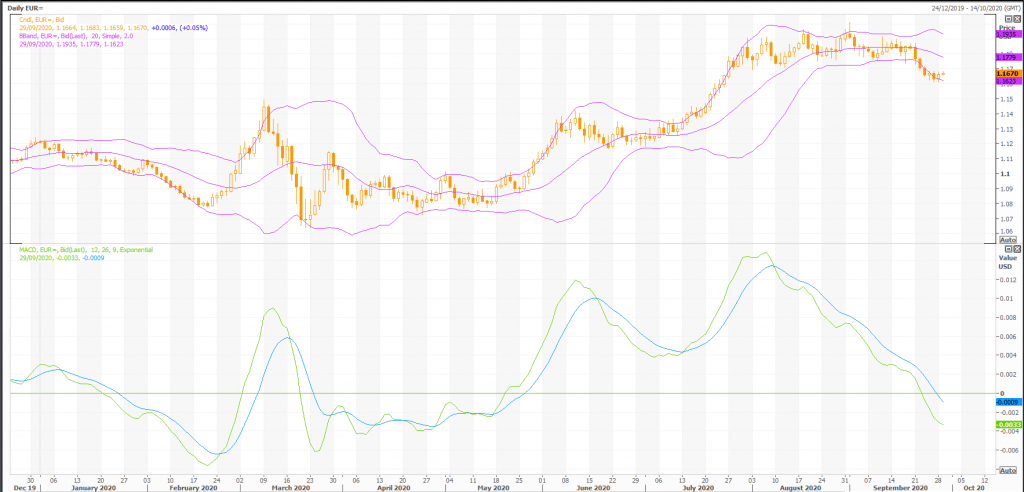
MACD
The Moving Average Convergence/Divergence indicator (MACD) gives signals when it crosses its 9 period signal line. The last signal was a sell 36 period(s) ago.
Rex Takasugi – TD Profile
FOREX EUR= closed up 0.001 at 1.167. Volume was 90% below average (consolidating) and Bollinger Bands were 17% narrower than normal.
Open High Low Close Volume 1.166 1.168 1.166 1.167 10,596 Technical Outlook Short Term: Neutral Intermediate Term: Bearish Long Term: Bullish Moving Averages: 10-period 50-period 200-period Close: 1.17 1.18 1.12 Volatility: 6 7 9 Volume: 105,094 99,343 100,585
Short-term traders should pay closer attention to buy/sell arrows while intermediate/long-term traders should place greater emphasis on the Bullish or Bearish trend reflected in the lower ribbon.
Summary
FOREX EUR= is currently 3.8% above its 200-period moving average and is in an downward trend. Volatility is low as compared to the average volatility over the last 10 periods.
Our volume indicators reflect moderate flows of volume out of EUR= (mildly bearish). Our trend forecasting oscillators are currently bearish on EUR= and have had this outlook for the last 18 periods.