
Euro: EUR/USD (EUR=X) Still In Uptrend – Live Trading News
Euro/US Dollar Exchange Rate
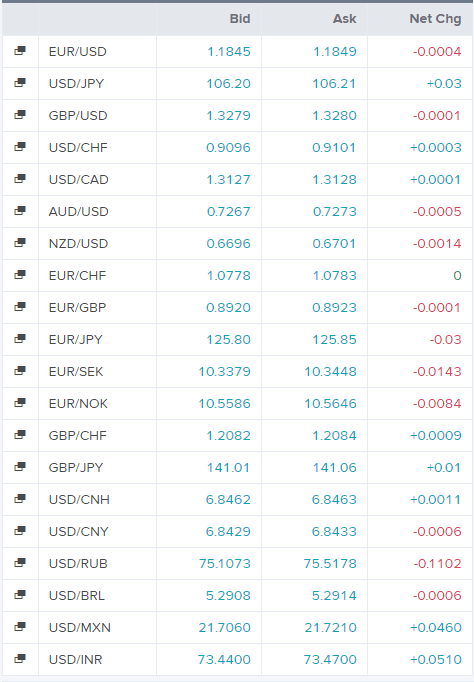
Today’s Forex Rates
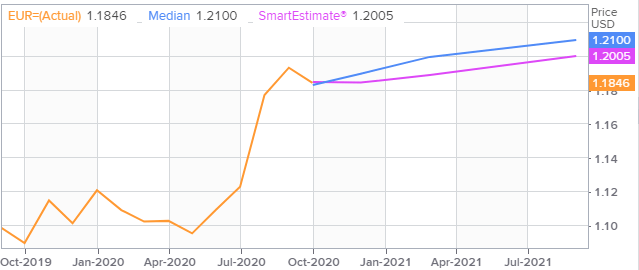
Euro/US Dollar FX Polls
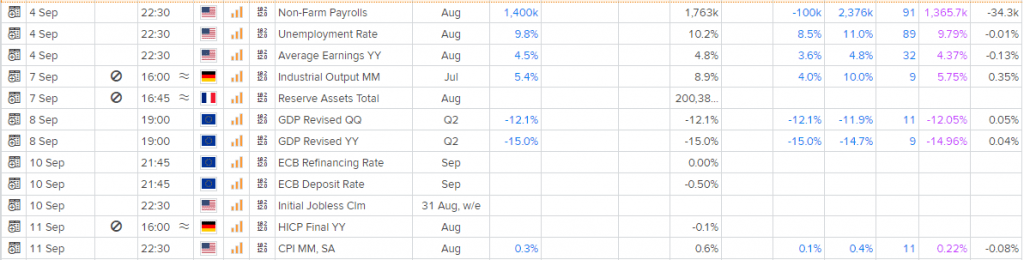
Economic Events
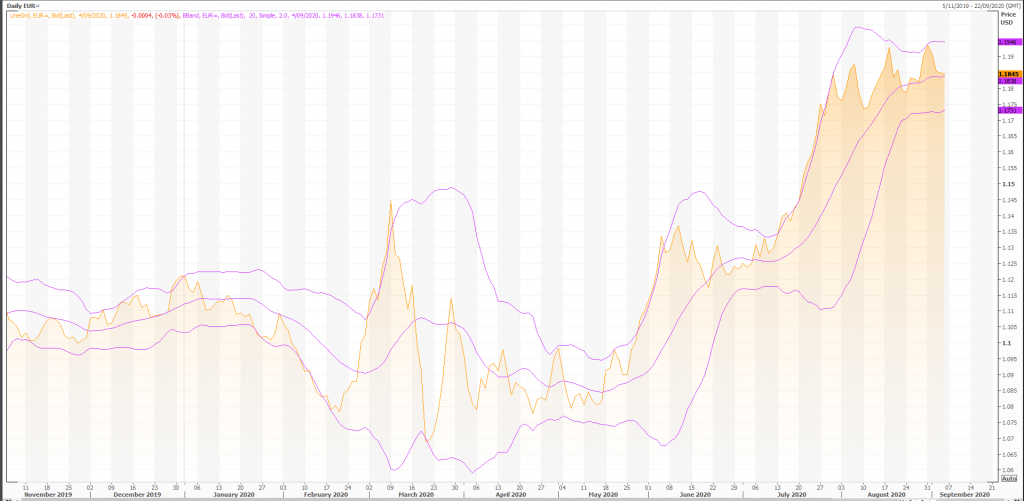
Technical Indicators
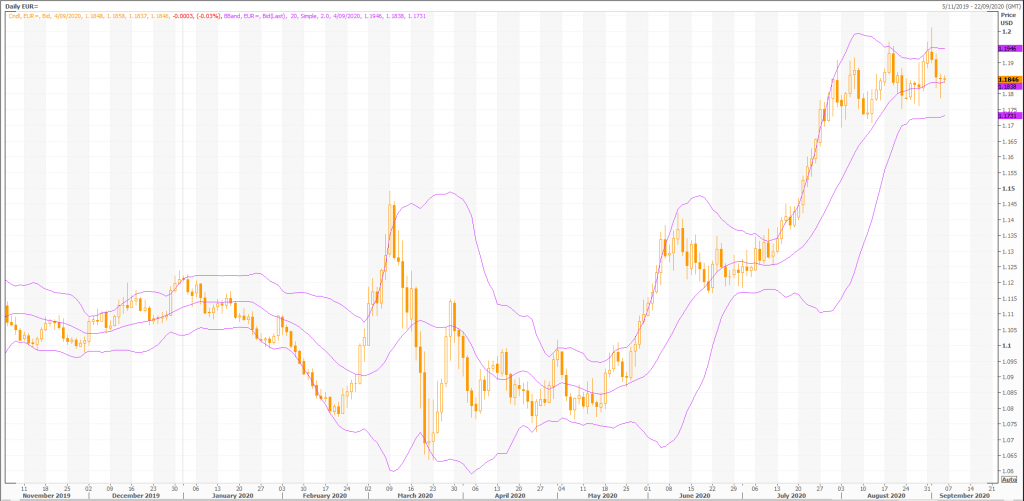
Overall, the bias in prices is: Upwards.
The projected upper bound is: 1.20.
The projected lower bound is: 1.17.
The projected closing price is: 1.19.
Candlesticks
A black body occurred (because prices closed lower than they opened).
During the past 10 bars, there have been 4 white candles and 6 black candles for a net of 2 black candles. During the past 50 bars, there have been 32 white candles and 18 black candles for a net of 14 white candles.
A spinning top occurred (a spinning top is a candle with a small real body). Spinning tops identify a session in which there is little price action (as defined by the difference between the open and the close). During a rally or near new highs, a spinning top can be a sign that prices are losing momentum and the bulls may be in trouble.
Three black candles occurred in the last three days. Although these candles were not big enough to create three black crows, the steady downward pattern is bearish.
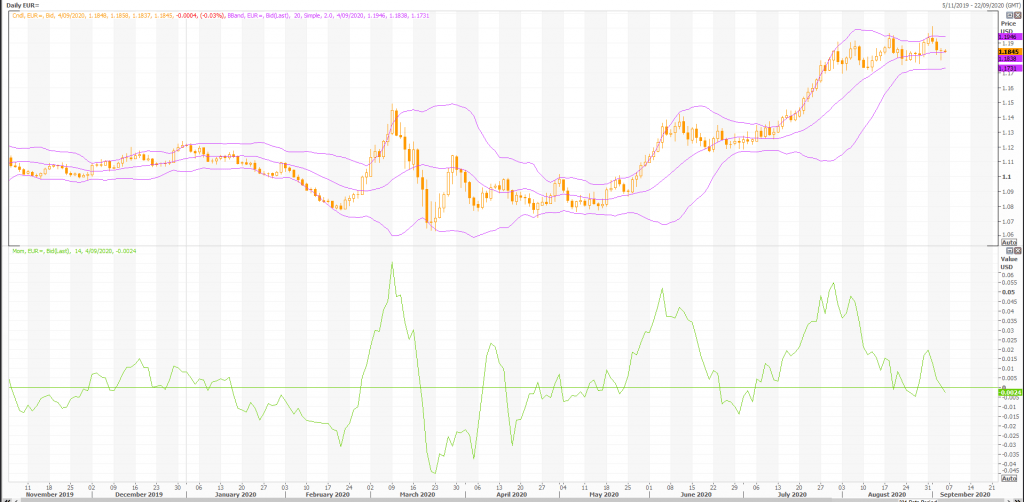
Momentum Indicators
Momentum is a general term used to describe the speed at which prices move over a given time period. Generally, changes in momentum tend to lead to changes in prices. This expert shows the current values of four popular momentum indicators.
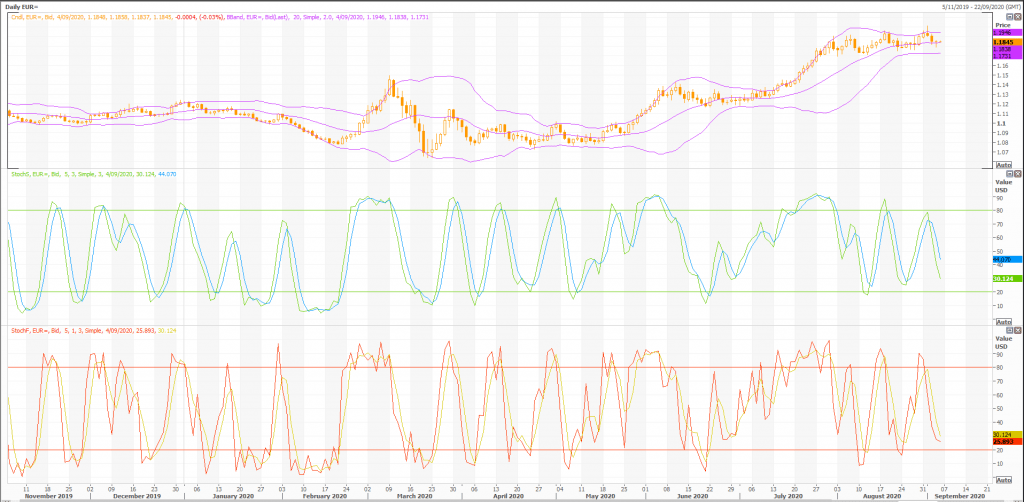
Stochastic Oscillator
One method of interpreting the Stochastic Oscillator is looking for overbought areas (above 80) and oversold areas (below 20). The Stochastic Oscillator is 30.2293. This is not an overbought or oversold reading. The last signal was a sell 12 period(s) ago.
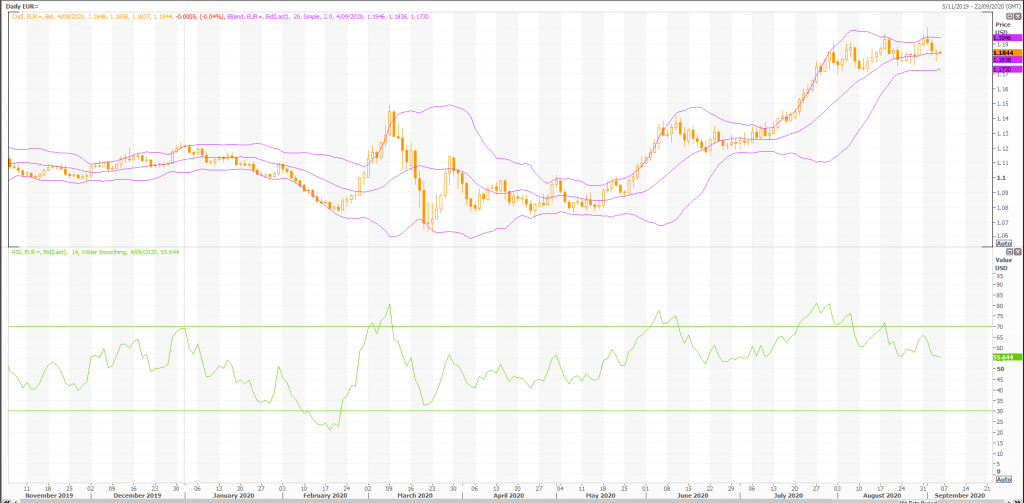
Relative Strength Index (RSI)
The RSI shows overbought (above 70) and oversold (below 30) areas. The current value of the RSI is 55.64. This is not a topping or bottoming area. A buy or sell signal is generated when the RSI moves out of an overbought/oversold area. The last signal was a sell 12 period(s) ago.
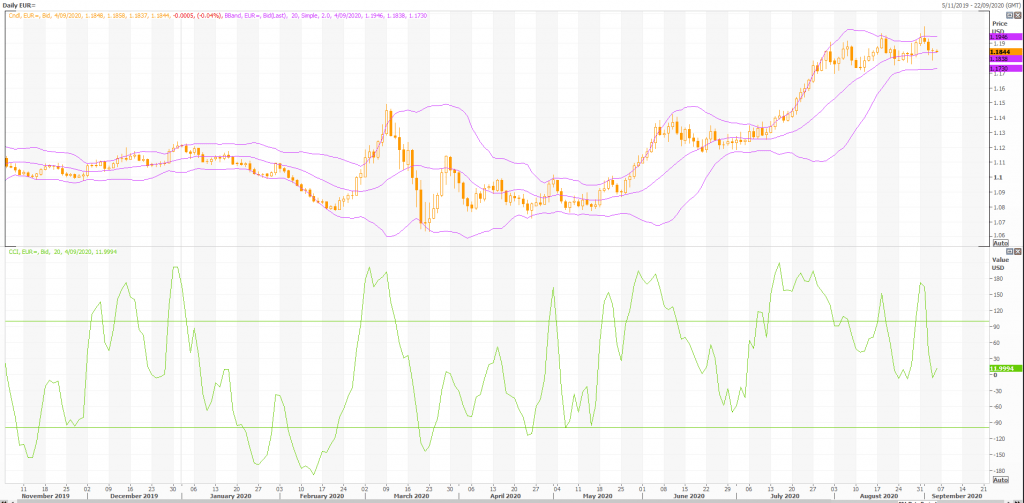
Commodity Channel Index (CCI)
The CCI shows overbought (above 100) and oversold (below -100) areas. The current value of the CCI is -20. This is not a topping or bottoming area. The last signal was a sell 2 period(s) ago.
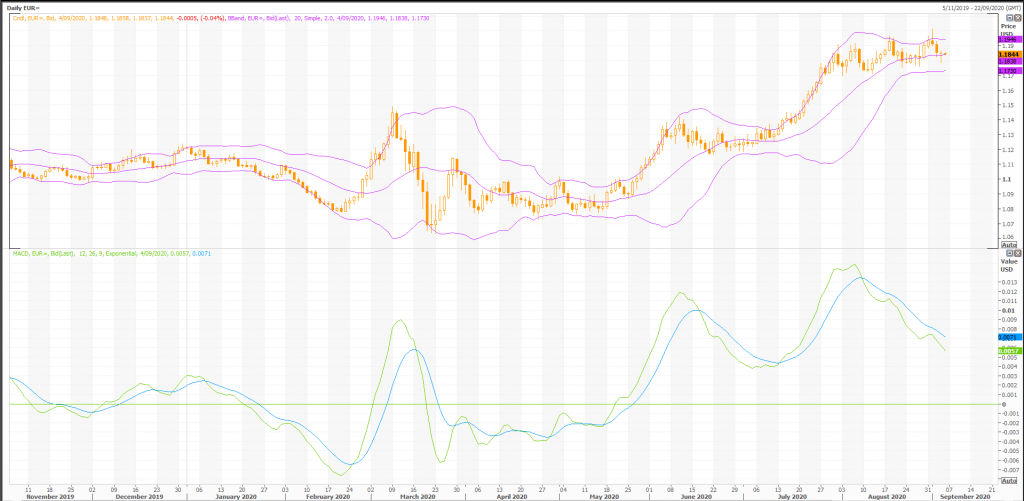
MACD
The Moving Average Convergence/Divergence indicator (MACD) gives signals when it crosses its 9 period signal line. The last signal was a sell 19 period(s) ago.
Rex Takasugi – TD Profile
FOREX EUR= closed down -0.001 at 1.184. Volume was 83% below average (consolidating) and Bollinger Bands were 43% narrower than normal.
Open High Low Close Volume 1.185 1.186 1.184 1.184 18,363 Technical Outlook Short Term: Neutral Intermediate Term: Bearish Long Term: Bullish Moving Averages: 10-period 50-period 200-period Close: 1.19 1.16 1.12 Volatility: 6 7 9 Volume: 90,440 101,049 96,787
Short-term traders should pay closer attention to buy/sell arrows while intermediate/long-term traders should place greater emphasis on the Bullish or Bearish trend reflected in the lower ribbon.
Summary
FOREX EUR= is currently 5.9% above its 200-period moving average and is in an downward trend. Volatility is extremely low when compared to the average volatility over the last 10 periods. There is a good possibility that there will be an increase in volatility along with sharp price fluctuations in the near future.
Our volume indicators reflect volume flowing into and out of EUR= at a relatively equal pace (neutral). Our trend forecasting oscillators are currently bearish on EUR= and have had this outlook for the last 1 periods. our momentum oscillator has set a new 14-period low while the security price has not. This is a bearish divergence.