
Euro: EUR/USD (EUR=X) Stays Vulnerable to a Deeper Setback – Live Trading News
Euro News
German GfK Consumer Climate remains in negative territory, as consumers are nervous about the economy. The indicator showed little change in September, at -1.8 points. Eurozone and German Manufacturing PMIs improved in September, with readings of 53.7 and 53.6, respectively.
A reading above 50 points to expansion. However, Eurozone and German Services PMIs indicated contraction, with readings of 47.6 and 49.1, respectively. German Ifo Business Climate accelerated for a fifth straight month, rising from 92.6 to 93.4 in September.
In the US, Federal Reserve Chair Powell had a busy week testifying on Capitol Hill. Powell reiterated that the Fed was using all available tools to support the budding economic recovery. He also called on Congress to provide additional fiscal stimulus.
The US Flash Manufacturing PMI for September came in at 53.5, almost unchanged from 53.4 a month earlier. Importantly, the reading beat the estimate of 52.5 points. The index has been in expansion territory for four straight months, with readings above the 50-level, which separates expansion from contraction. On the services front, Flash Services PMI came in at 54.6, just shy of the previous release of 54.8 points. The respectable reading points to a solid rise in business activity, another sign that the economic recovery is strengthening.
Euro/US Dollar Exchange Rate
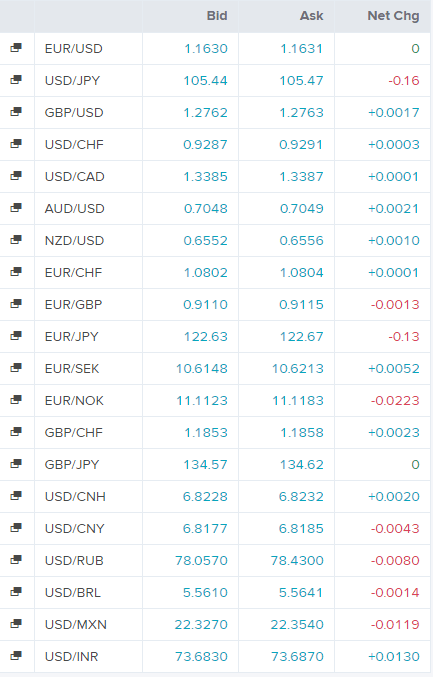
Today’s Forex Rates
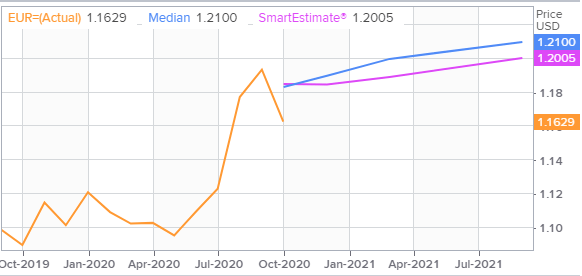
EUR/USD FX Polls
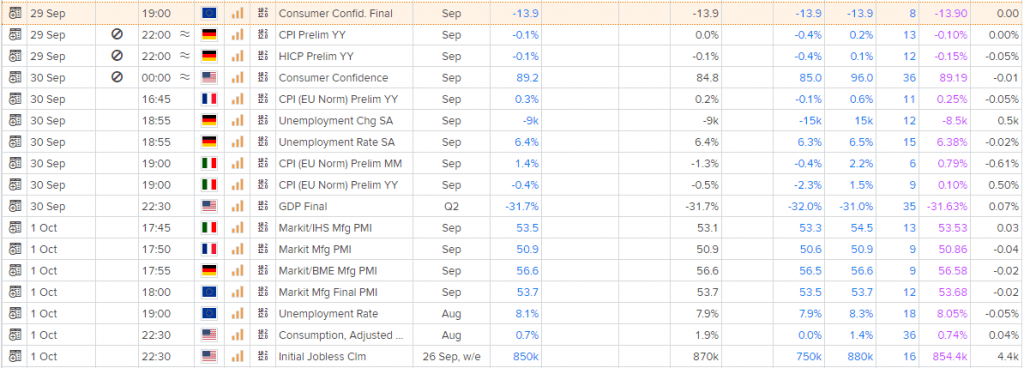
Economic Events
Technical Indicators
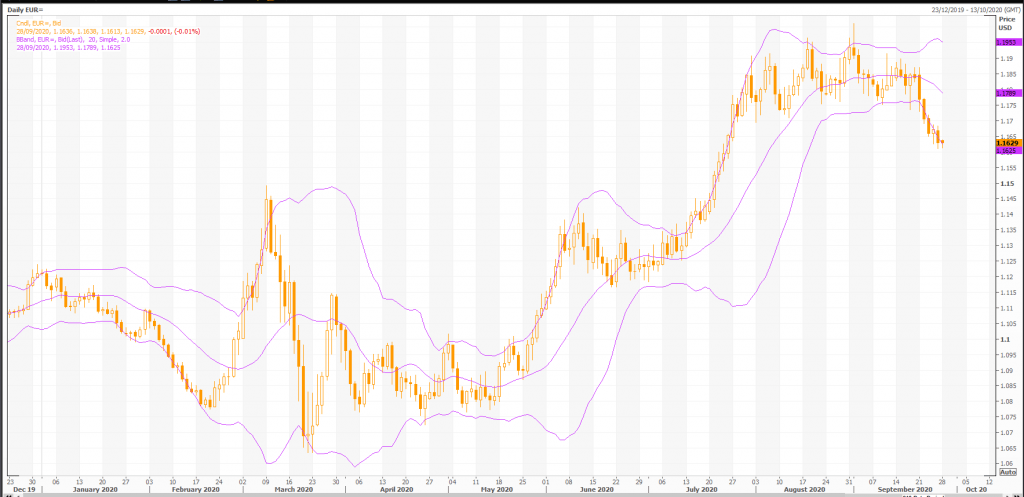
Overall, the bias in prices is: Sideways.
The projected upper bound is: 1.18.
The projected lower bound is: 1.15.
The projected closing price is: 1.16.
Candlesticks
A black body occurred (because prices closed lower than they opened).
During the past 10 bars, there have been 2 white candles and 8 black candles for a net of 6 black candles. During the past 50 bars, there have been 27 white candles and 23 black candles for a net of 4 white candles.
A hammer occurred (a hammer has a long lower shadow and closes near the high). Hammers must appear after a significant decline or when prices are oversold (which appears to be the case with FOREX EUR=) to be valid. When this occurs, it usually indicates the formation of a support level and is thus considered a bullish pattern.
A hanging man occurred (a hanging man has a very long lower shadow and a small real body). This pattern can be bullish or bearish, depending on the trend. If it occurs during an uptrend it is called a hanging man line and signifies a reversal top. If it occurs during a downtrend (which appears to be the case with FOREX EUR=) it is called a bullish hammer.
A long lower shadow occurred. This is typically a bullish signal (particularly when it occurs near a low price level, at a support level, or when the security is oversold).
A spinning top occurred (a spinning top is a candle with a small real body). Spinning tops identify a session in which there is little price action (as defined by the difference between the open and the close). During a rally or near new highs, a spinning top can be a sign that prices are losing momentum and the bulls may be in trouble.
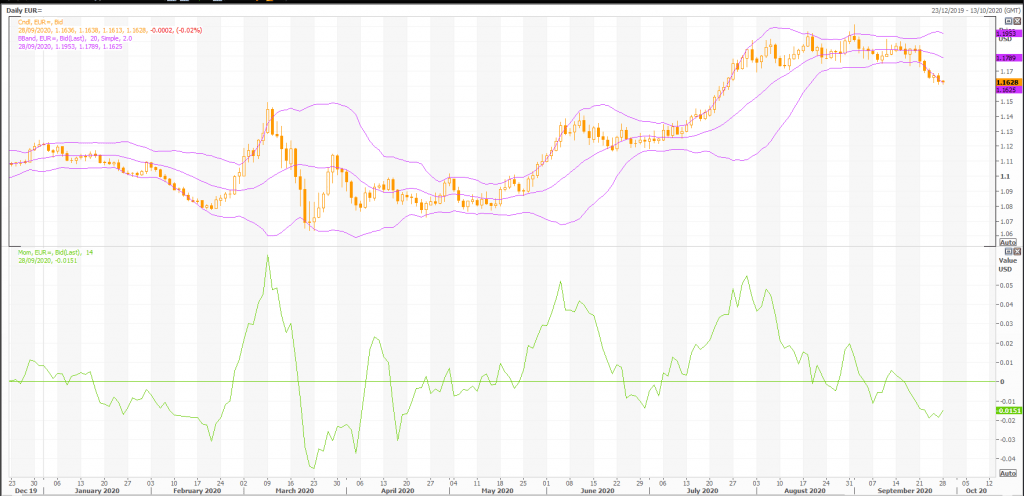
Momentum Indicators
Momentum is a general term used to describe the speed at which prices move over a given time period. Generally, changes in momentum tend to lead to changes in prices. This expert shows the current values of four popular momentum indicators.
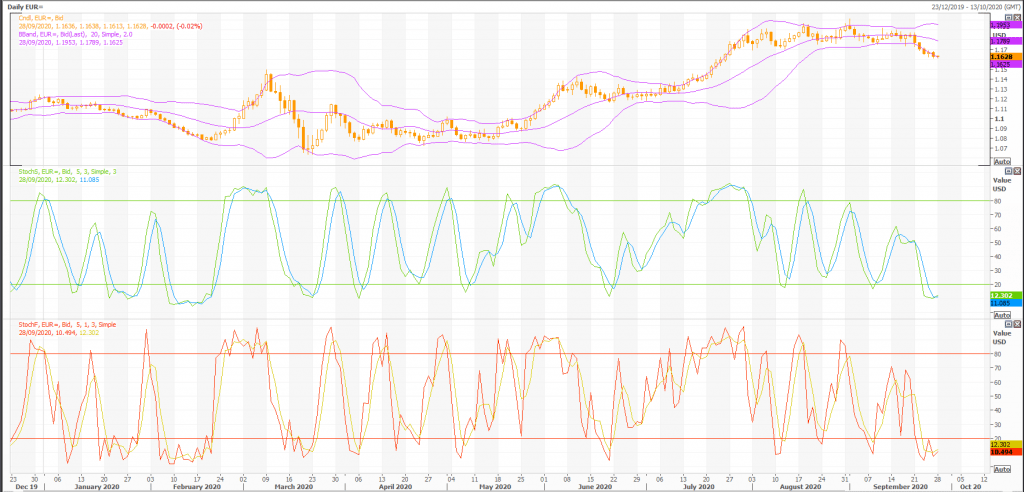
Stochastic Oscillator
One method of interpreting the Stochastic Oscillator is looking for overbought areas (above 80) and oversold areas (below 20). The Stochastic Oscillator is 12.8741. This is an oversold reading. However, a signal is not generated until the Oscillator crosses above 20 The last signal was a buy 13 period(s) ago.
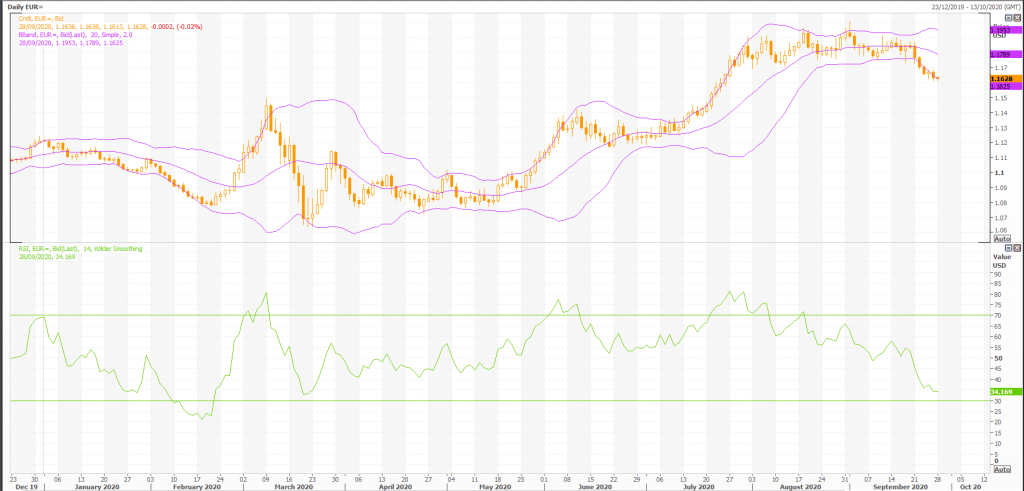
Relative Strength Index (RSI)
The RSI shows overbought (above 70) and oversold (below 30) areas. The current value of the RSI is 34.47. This is not a topping or bottoming area. A buy or sell signal is generated when the RSI moves out of an overbought/oversold area. The last signal was a sell 28 period(s) ago.
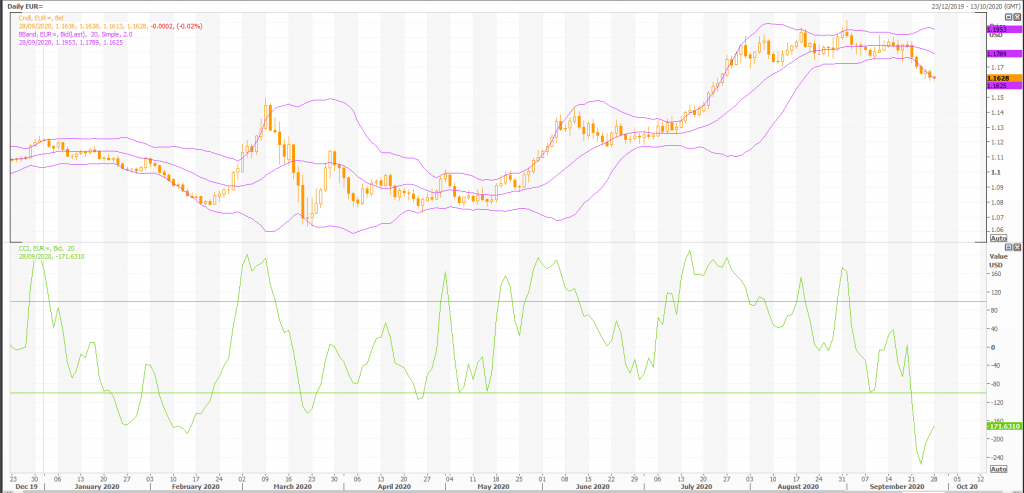
Commodity Channel Index (CCI)
The CCI shows overbought (above 100) and oversold (below -100) areas. The current value of the CCI is -127.This is an oversold reading. However, a signal isn’t generated until the indicator crosses above -100. The last signal was a buy 13 period(s) ago.
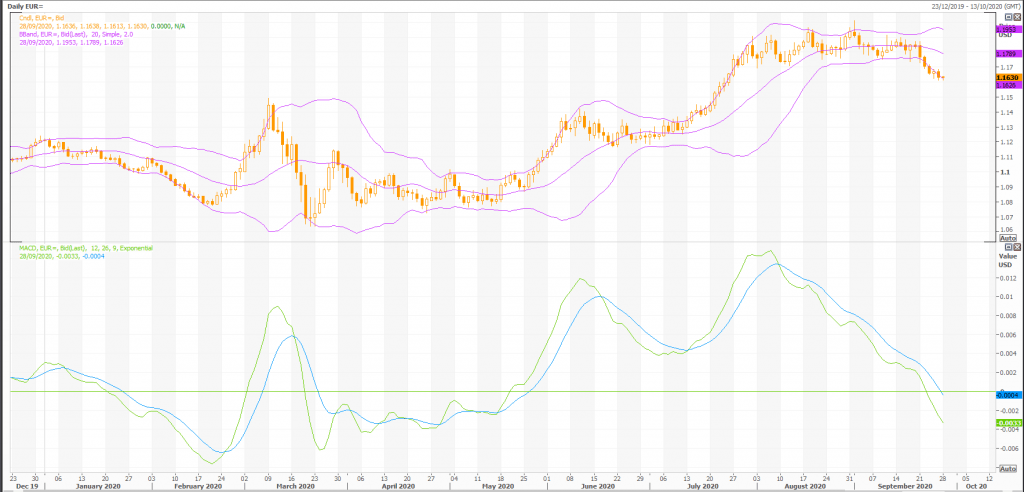
MACD
The Moving Average Convergence/Divergence indicator (MACD) gives signals when it crosses its 9 period signal line. The last signal was a sell 35 period(s) ago.
Rex Takasugi – TD Profile
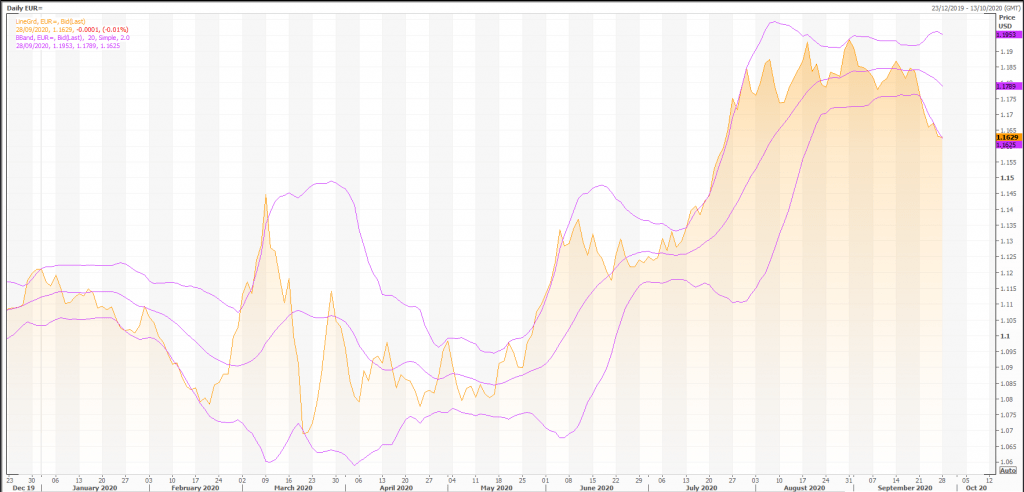
FOREX EUR= closed up 0.000 at 1.163. Volume was 93% below average (consolidating) and Bollinger Bands were 13% narrower than normal.
Open High Low Close Volume 1.164 1.164 1.161 1.163 7,407 Technical Outlook Short Term: Oversold Intermediate Term: Bearish Long Term: Bullish Moving Averages: 10-period 50-period 200-period Close: 1.17 1.18 1.12 Volatility: 5 8 9 Volume: 105,532 99,777 100,516
Short-term traders should pay closer attention to buy/sell arrows while intermediate/long-term traders should place greater emphasis on the Bullish or Bearish trend reflected in the lower ribbon.
Summary
FOREX EUR= is currently 3.5% above its 200-period moving average and is in an downward trend. Volatility is extremely low when compared to the average volatility over the last 10 periods. There is a good possibility that there will be an increase in volatility along with sharp price fluctuations in the near future.
Our volume indicators reflect moderate flows of volume out of EUR= (mildly bearish). Our trend forecasting oscillators are currently bearish on EUR= and have had this outlook for the last 17 periods.