
Euro: EUR/USD (EUR=X) Buyers Must Defend The 1.1650 Level – Live Trading News
Euro News
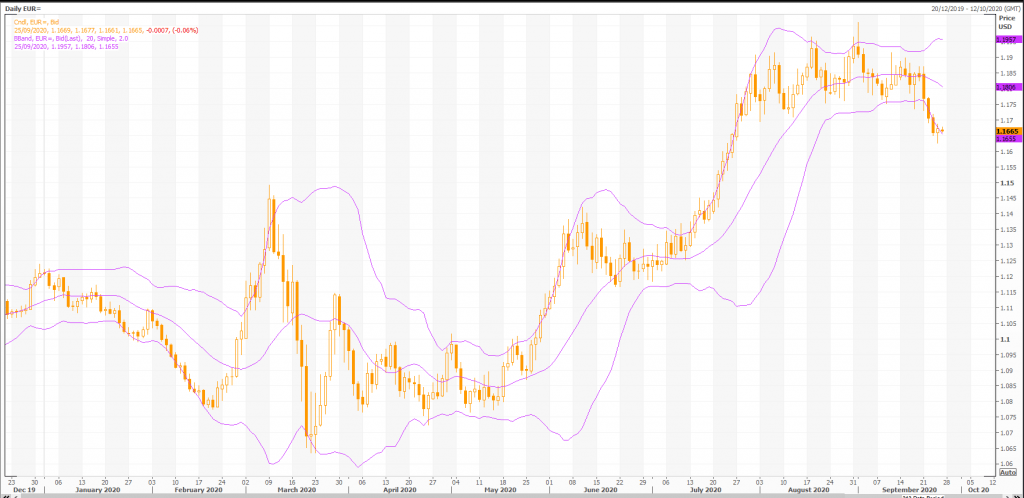
The euro has broken below important technical support against the US dollar this week, leaving the pair exposed to further losses.
EUR/USD technical analysis highlights the overall importance of the 1.1650 level to the pair’s ongoing uptrend.
The EUR/USD pair has lost more than 200 points since the start of the week, as the US Dollar Index stages a breakout above 94.
EUR/USD analysis over the medium to long-term shows that buyers must defend the 1.1650 level to avoid further heavy technical selling.
Euro/US Dollar Exchange Rate
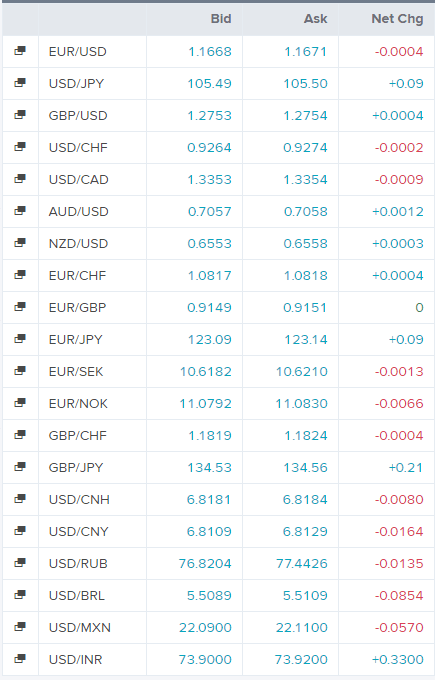
Today’s Forex Rates
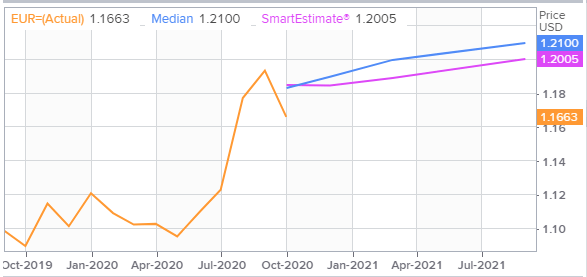
EUR/USD FX Polls
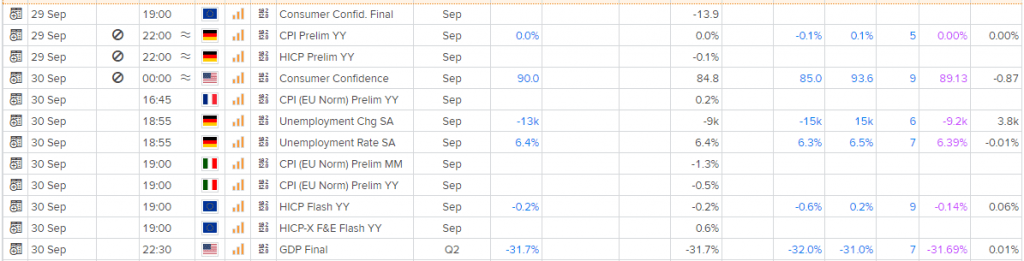
Economic Events
Technical Indicators
Overall, the bias in prices is: Sideways.
The projected upper bound is: 1.18.
The projected lower bound is: 1.15.
The projected closing price is: 1.17.
Candlesticks
A black body occurred (because prices closed lower than they opened).
During the past 10 bars, there have been 3 white candles and 7 black candles for a net of 4 black candles. During the past 50 bars, there have been 28 white candles and 22 black candles for a net of 6 white candles.
A spinning top occurred (a spinning top is a candle with a small real body). Spinning tops identify a session in which there is little price action (as defined by the difference between the open and the close). During a rally or near new highs, a spinning top can be a sign that prices are losing momentum and the bulls may be in trouble.
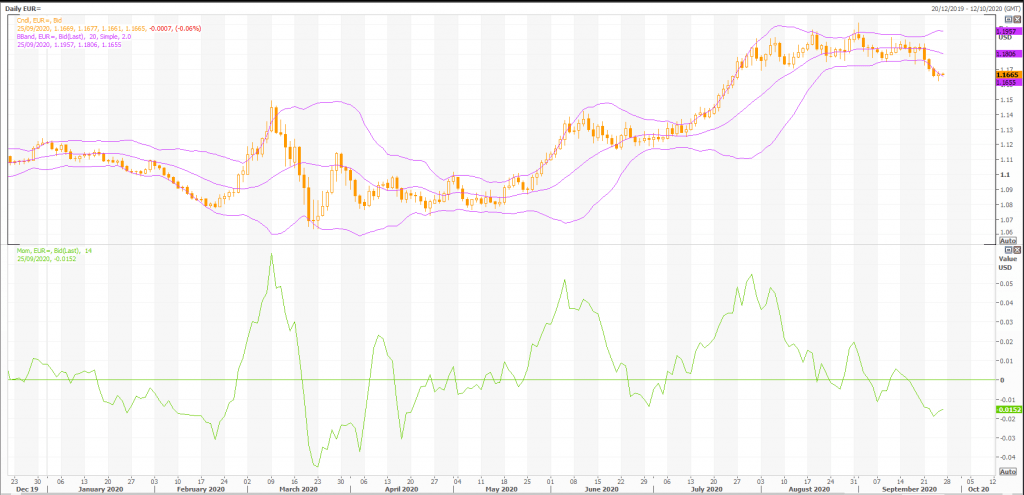
Momentum Indicators
Momentum is a general term used to describe the speed at which prices move over a given time period. Generally, changes in momentum tend to lead to changes in prices. This expert shows the current values of four popular momentum indicators.
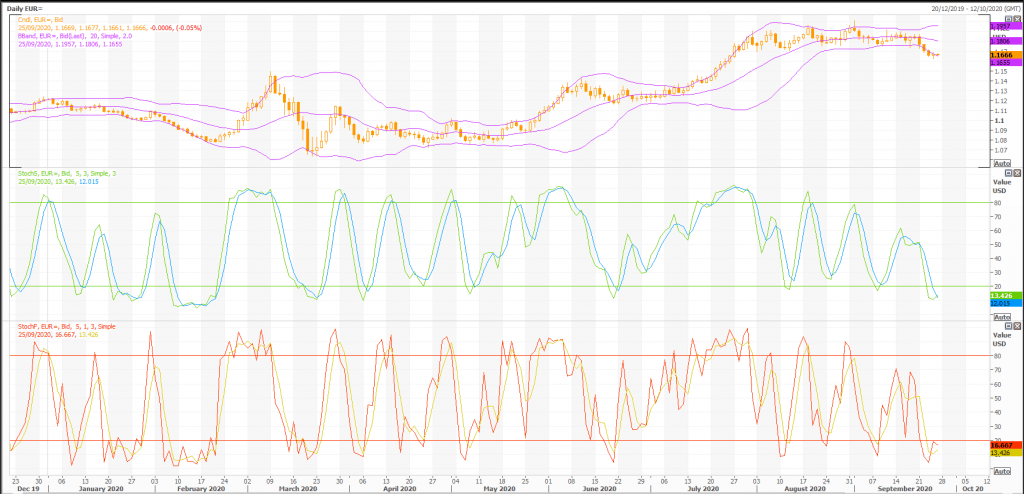
Stochastic Oscillator
One method of interpreting the Stochastic Oscillator is looking for overbought areas (above 80) and oversold areas (below 20). The Stochastic Oscillator is 13.8655. This is an oversold reading. However, a signal is not generated until the Oscillator crosses above 20 The last signal was a buy 12 period(s) ago.
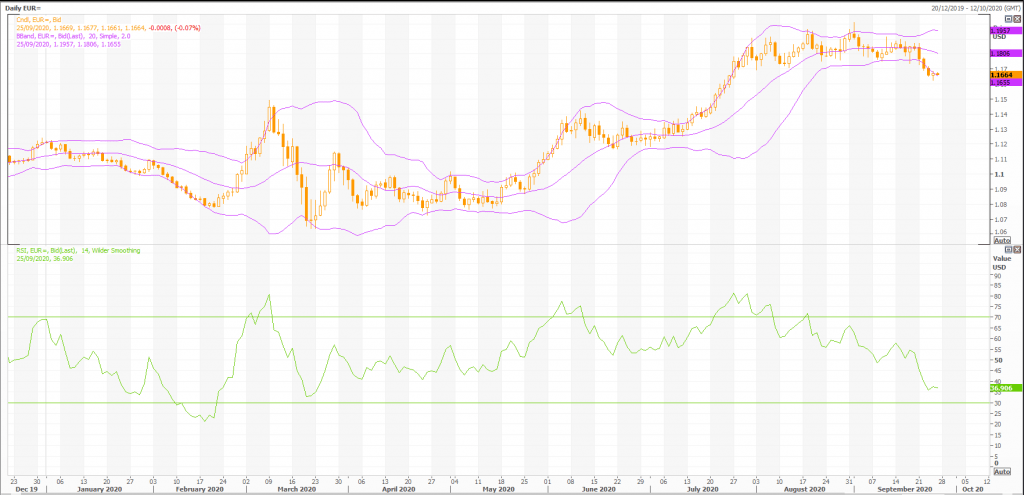
Relative Strength Index (RSI)
The RSI shows overbought (above 70) and oversold (below 30) areas. The current value of the RSI is 37.15. This is not a topping or bottoming area. A buy or sell signal is generated when the RSI moves out of an overbought/oversold area. The last signal was a sell 27 period(s) ago.
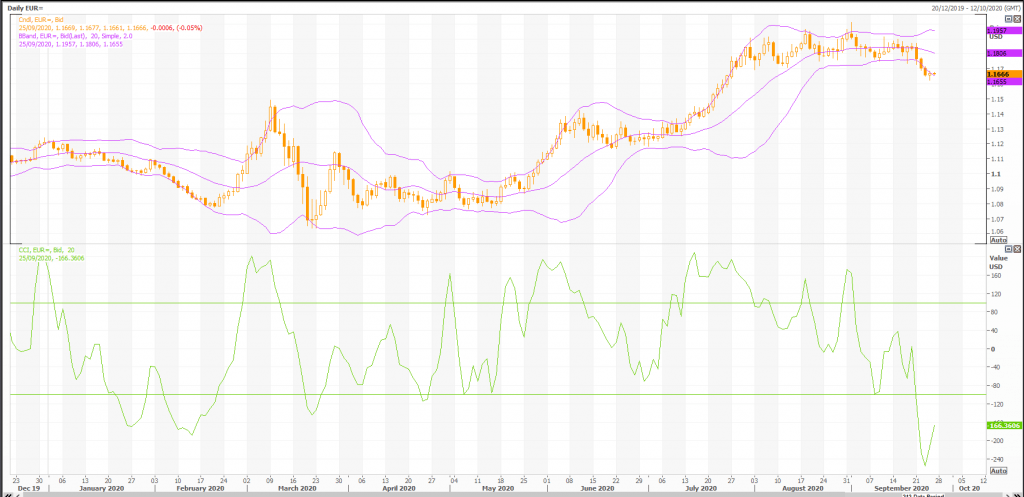
Commodity Channel Index (CCI)
The CCI shows overbought (above 100) and oversold (below -100) areas. The current value of the CCI is -132.This is an oversold reading. However, a signal isn’t generated until the indicator crosses above -100. The last signal was a buy 12 period(s) ago.
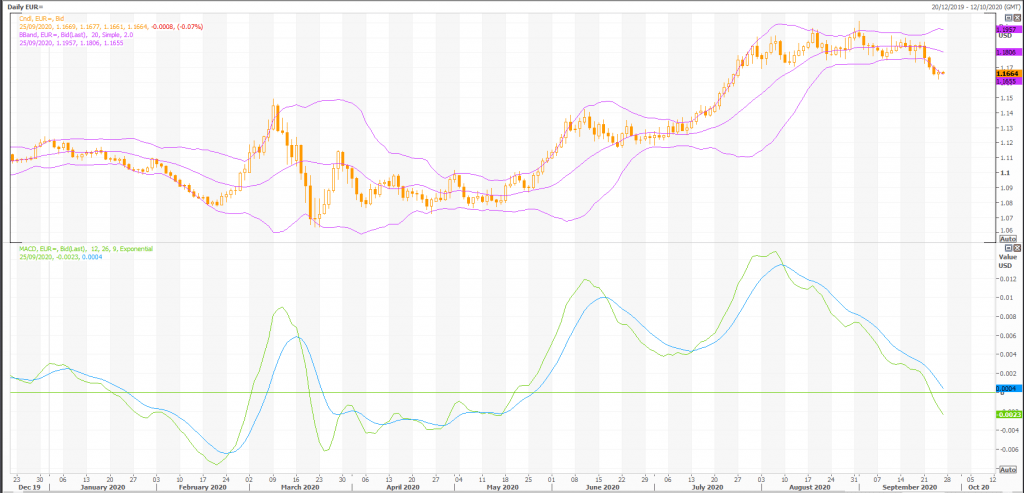
MACD
The Moving Average Convergence/Divergence indicator (MACD) gives signals when it crosses its 9 period signal line. The last signal was a sell 34 period(s) ago.
Rex Takasugi – TD Profile
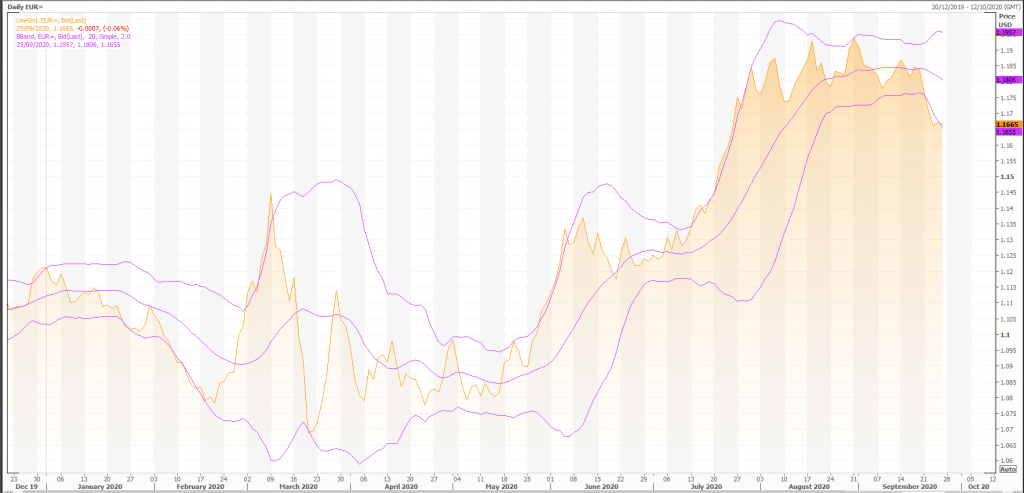
FOREX EUR= closed down -0.000 at 1.167. Volume was 87% below average (consolidating) and Bollinger Bands were 19% narrower than normal.
Open High Low Close Volume 1.167 1.168 1.166 1.167 14,337 Technical Outlook Short Term: Oversold Intermediate Term: Bearish Long Term: Bullish Moving Averages: 10-period 50-period 200-period Close: 1.18 1.18 1.12 Volatility: 5 7 9 Volume: 101,809 99,537 100,240
Short-term traders should pay closer attention to buy/sell arrows while intermediate/long-term traders should place greater emphasis on the Bullish or Bearish trend reflected in the lower ribbon.
Summary
FOREX EUR= is currently 3.8% above its 200-period moving average and is in an downward trend. Volatility is extremely low when compared to the average volatility over the last 10 periods. There is a good possibility that there will be an increase in volatility along with sharp price fluctuations in the near future.
Our volume indicators reflect moderate flows of volume out of EUR= (mildly bearish). Our trend forecasting oscillators are currently bearish on EUR= and have had this outlook for the last 16 periods.