
British Pound: GBP/USD (GBP=X) HEFFX Daily Technicals – Live Trading News
British Pound Outlook
Hopes for European Union/UK trade deal have been apparent in GBP derivative markets for weeks , and FX options remain a decent alternative to cash for those who want to benefit from a GBP rise with limited risk.
Long GBP/USD cash retains the risk of no deal, interim volatility and stops, even those well below the current spot, especially over the U.S election . But simple GBP call options give owners the right to buy GBP/USD at a predetermined level (strike) and expiry, only risking an up-front premium.
GBP/USD would also benefit from a Democrat sweep in the U.S election, which should pressure the USD, as U.S fiscal hopes buoy risk sentiment.
Or a two-month 1.3500 GBP call digital would return 4:1 if GBP/USD was above 1.3500 on Dec. 29.
Options strikes and expiries can be tailored to suit.
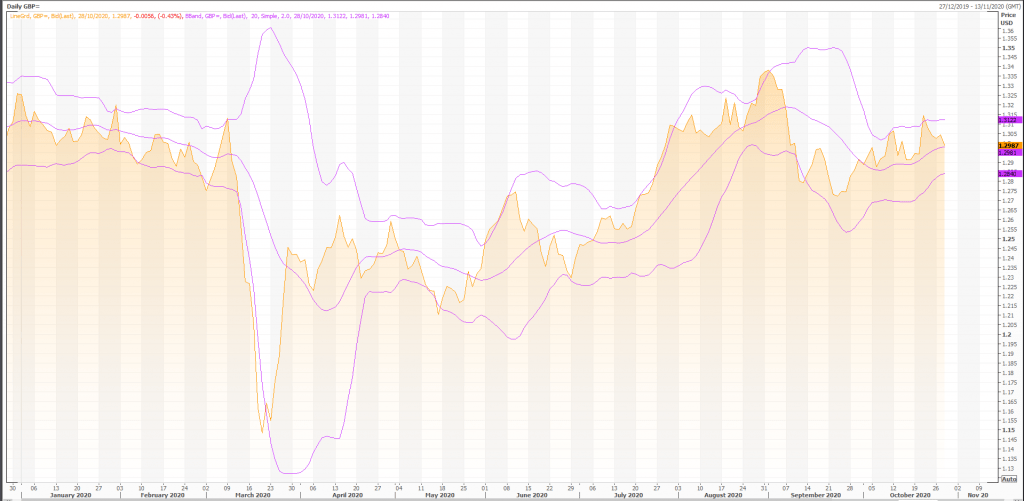
GBP/US Dollar Exchange Rate
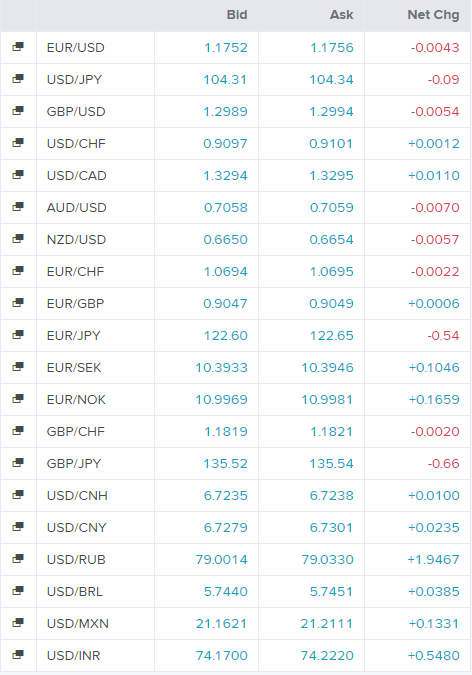
Today’s Forex Rates
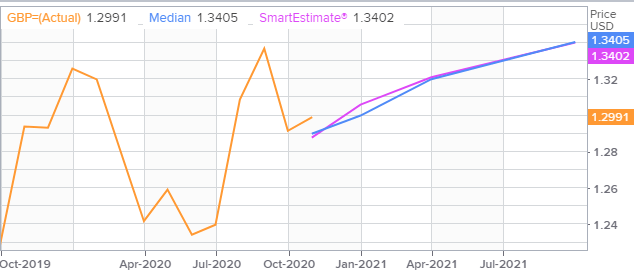
GBP/US Dollar FX Polls
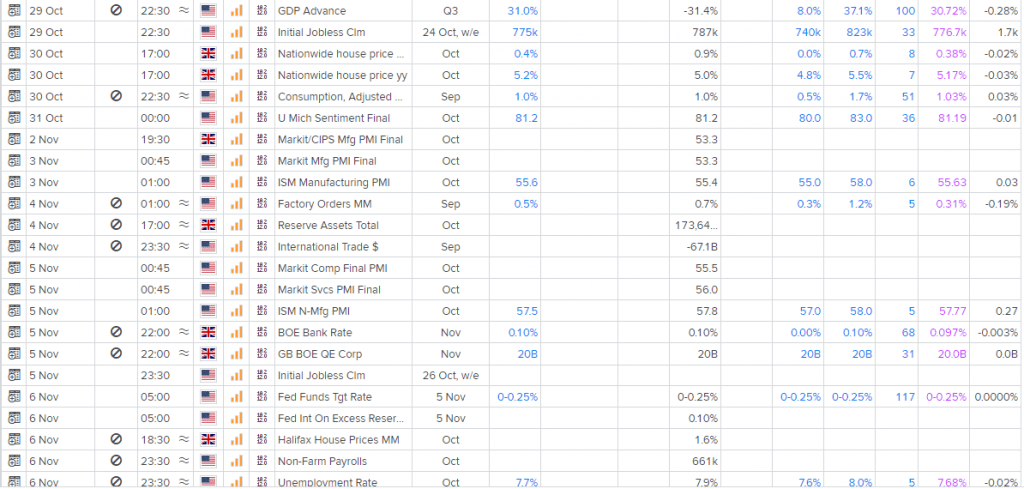
Economic Events
Technical Indicators
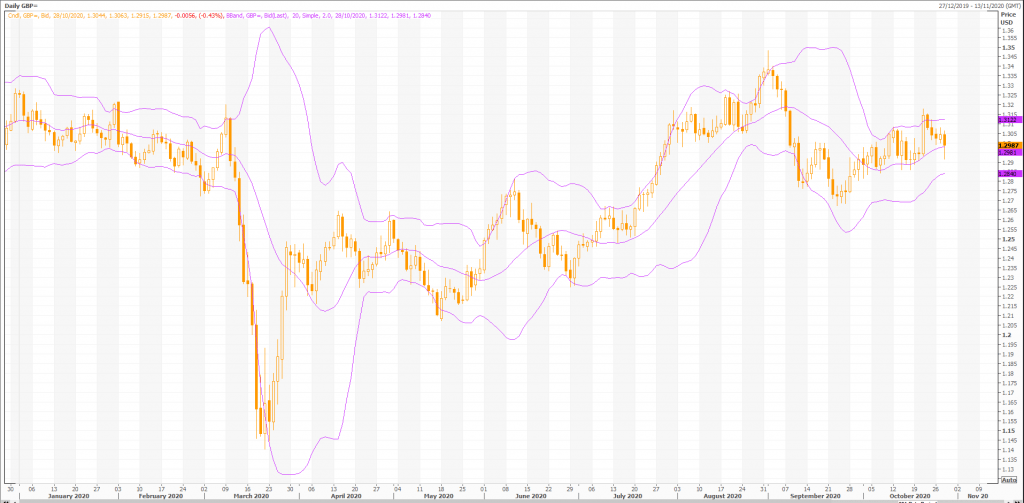
Overall, the bias in prices is: Sideways.
The projected upper bound is: 1.32.
The projected lower bound is: 1.27.
The projected closing price is: 1.30.
Candlesticks
A black body occurred (because prices closed lower than they opened).
During the past 10 bars, there have been 3 white candles and 7 black candles for a net of 4 black candles. During the past 50 bars, there have been 26 white candles and 24 black candles for a net of 2 white candles.
An engulfing bearish line occurred (where a black candle’s real body completely contains the previous white candle’s real body). The engulfing bearish pattern is bearish during an uptrend (which appears to be the case with FOREX GBP=). It then signifies that the momentum may be shifting from the bulls to the bears.
If the engulfing bearish pattern occurs during a downtrend, it may be a last engulfing bottom which indicates a bullish reversal. The test to see if this is the case is if the next candle closes above the bottom the current (black) candle’s real body.
Momentum Indicators
Momentum is a general term used to describe the speed at which prices move over a given time period. Generally, changes in momentum tend to lead to changes in prices. This expert shows the current values of four popular momentum indicators.
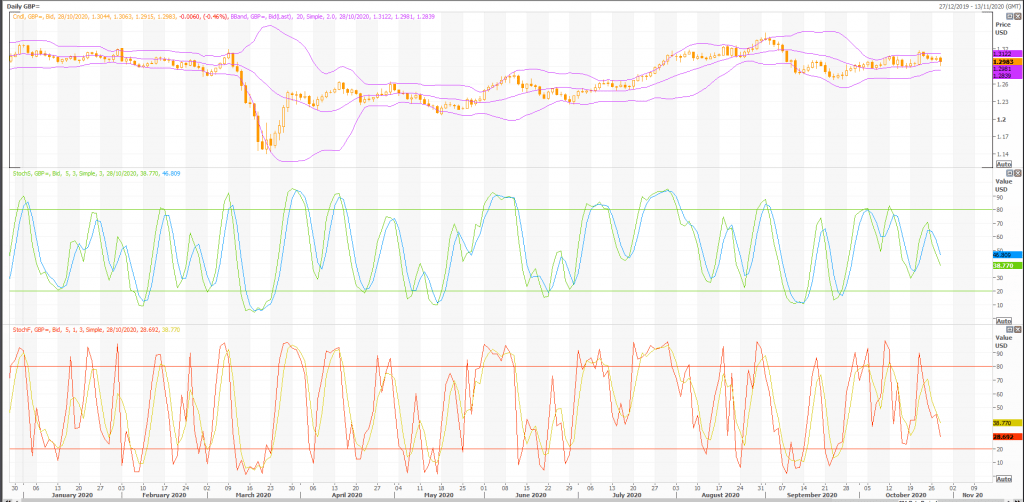
Stochastic Oscillator
One method of interpreting the Stochastic Oscillator is looking for overbought areas (above 80) and oversold areas (below 20). The Stochastic Oscillator is 39.3857. This is not an overbought or oversold reading. The last signal was a sell 11 period(s) ago.
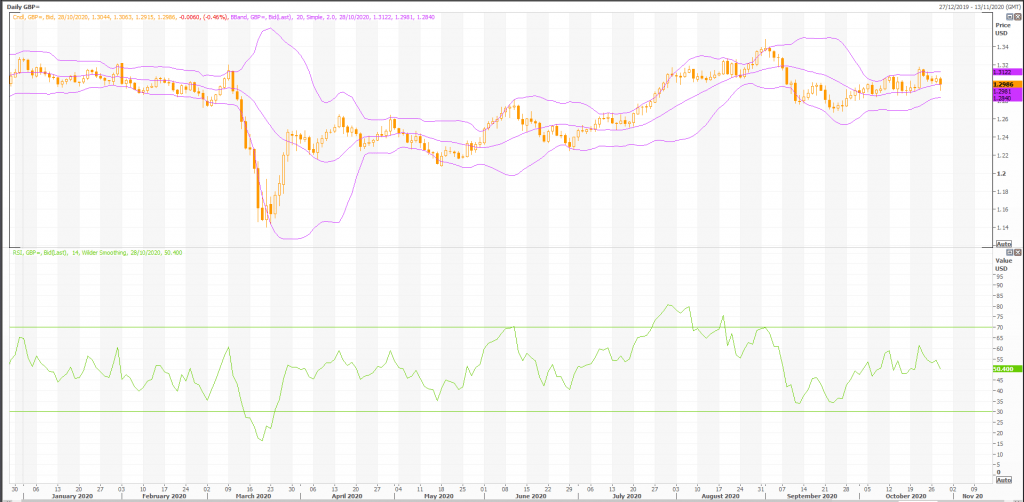
Relative Strength Index (RSI)
The RSI shows overbought (above 70) and oversold (below 30) areas. The current value of the RSI is 50.40. This is not a topping or bottoming area. A buy or sell signal is generated when the RSI moves out of an overbought/oversold area. The last signal was a sell 50 period(s) ago.
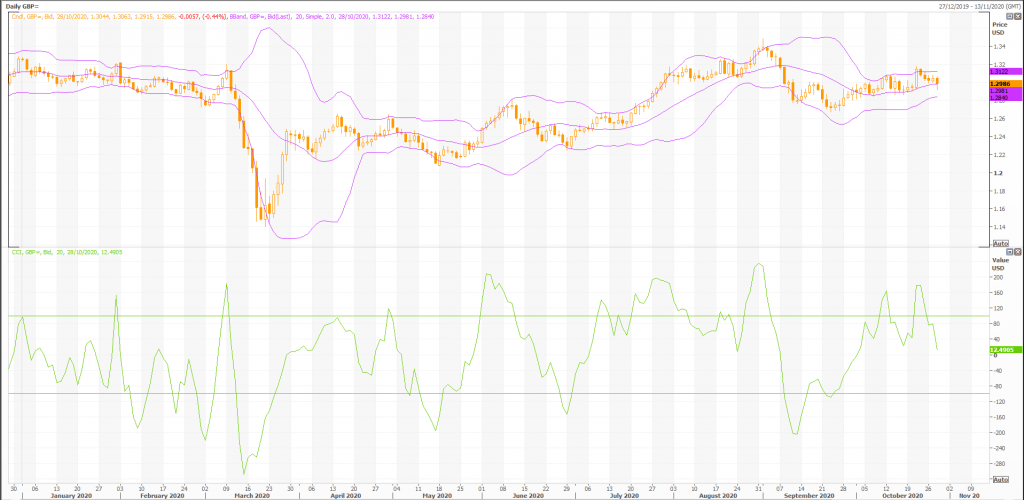
Commodity Channel Index (CCI)
The CCI shows overbought (above 100) and oversold (below -100) areas. The current value of the CCI is -23. This is not a topping or bottoming area. The last signal was a sell 3 period(s) ago.
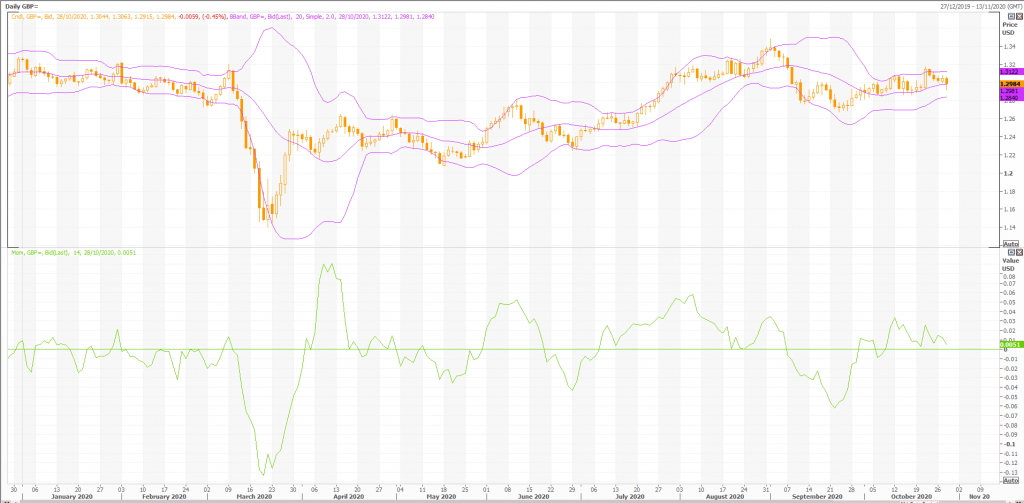
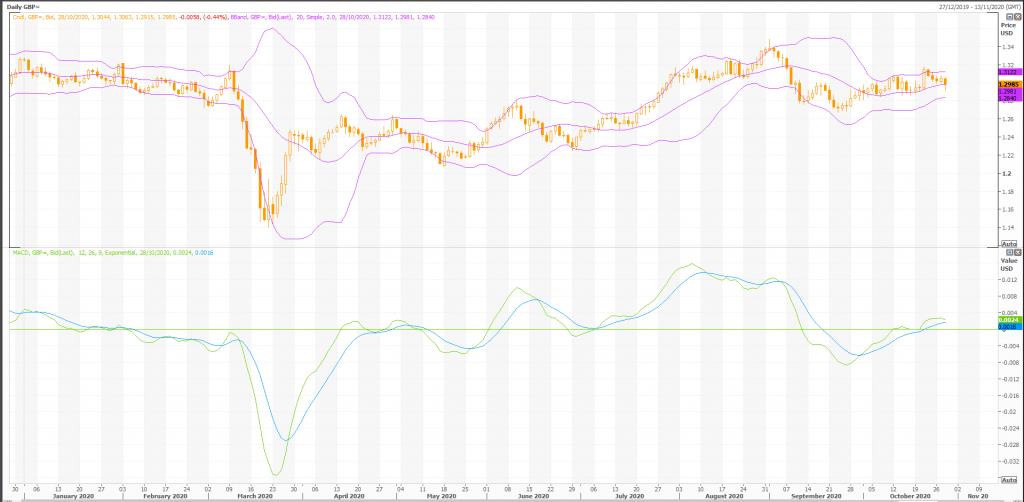
MACD
The Moving Average Convergence/Divergence indicator (MACD) gives signals when it crosses its 9 period signal line. The last signal was a buy 20 period(s) ago.
Rex Takasugi – TD Profile
FOREX GBP= closed down -0.006 at 1.299. Volume was 18% above average (neutral) and Bollinger Bands were 45% narrower than normal.
Open High Low Close Volume 1.304 1.306 1.291 1.299 154,062 Technical Outlook Short Term: Neutral Intermediate Term: Bullish Long Term: Bullish Moving Averages: 10-period 50-period 200-period Close: 1.30 1.30 1.27 Volatility: 11 12 14 Volume: 141,717 138,262 129,230
Short-term traders should pay closer attention to buy/sell arrows while intermediate/long-term traders should place greater emphasis on the Bullish or Bearish trend reflected in the lower ribbon.
Summary
FOREX GBP= is currently 2.2% above its 200-period moving average and is in an upward trend. Volatility is high as compared to the average volatility over the last 10 periods.
Our volume indicators reflect volume flowing into and out of GBP= at a relatively equal pace (neutral). Our trend forecasting oscillators are currently bullish on GBP= and have had this outlook for the last 10 periods.