
Bitcoin: BTC/USD (BTC=X) FOMO is Coming Soon – Live Trading News
Bitcoin Outlook
Closing at $10,793 on Sunday (Sept. 27), bitcoin set a record with 63 straight days of closing above $10,000, according to CoinDesk.
The cryptocurrency’s previous record was between Dec. 1, 2017, and Jan. 31, 2018, in which the coin was valued at above $10,000 for 62 days straight. At that time, the all-time high was $19,900 on Coinbase after it had surged almost 100 percent in two weeks.
This time around, the range has been sitting between $10,000 and $12,500, according to CoinDesk.
Coin Metrics statistics show that the 180-day returns volatility for bitcoin is down 41 percent so far in September, CoinDesk reported.
The closes over $10,000 haven’t been this high in some time, according to a chart from CoinDesk, with the only dates close being 28 days in July 2019 and 25 days in June 2019.
In other news, CoinFlip will now offer a bitcoin-enabled gift card marketplace, according to a report by Bitcoin Magazine.
The marketplace came about through a partnership with eGifter and will allow for the sale of gift cards in exchange for bitcoin.
That will allow more underbanked residents to invest in bitcoin through CoinFlip and also exchange the cryptocurrency for goods and services. The ultimate goal for bitcoin is to become a currency that can be used anywhere just like most mainstream currencies, such as cash or debit cards, CoinFlip reported, but the idea of using gift cards as a middleman between it and retailers is an important step.
Technical Indicators
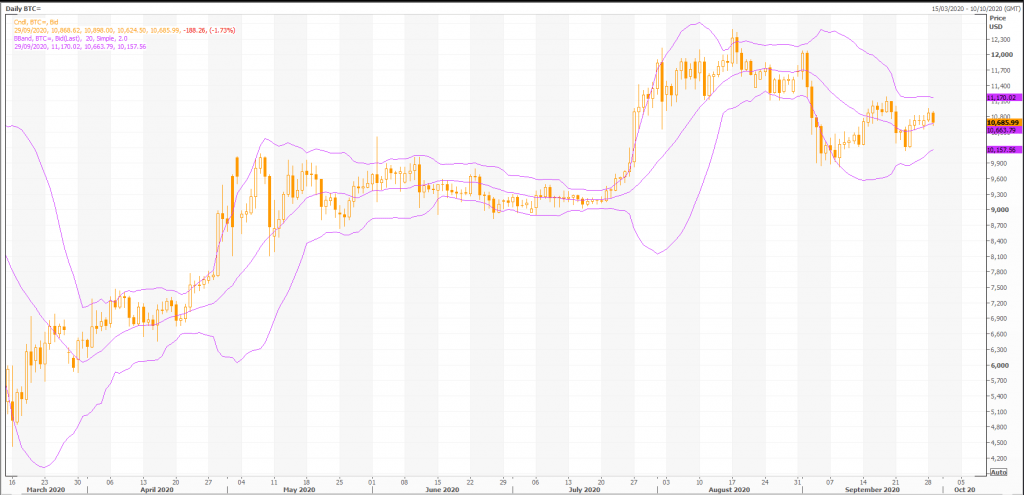
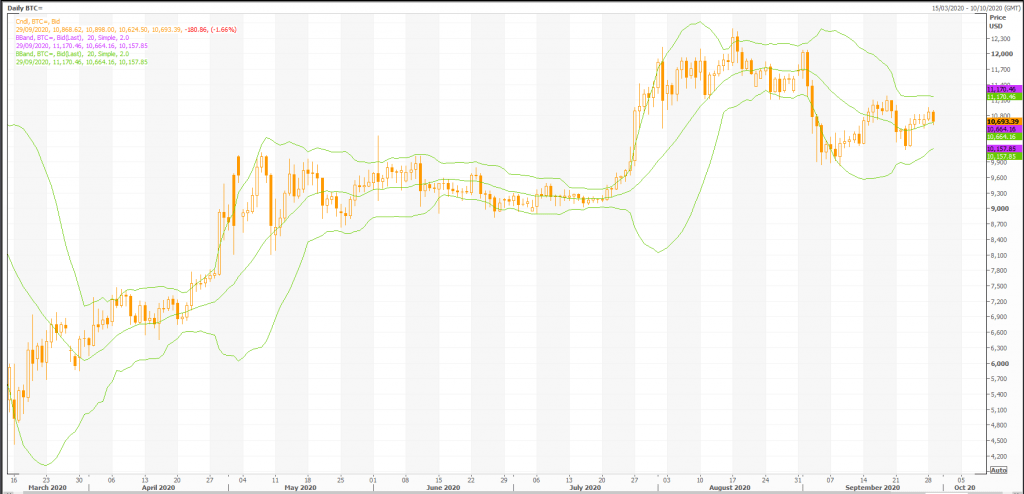
Overall, the bias in prices is: Upwards.
By the way, prices are vulnerable to a correction towards 10,577.66.
The projected upper bound is: 11,496.15.
The projected lower bound is: 9,876.05.
Candlesticks
A black body occurred (because prices closed lower than they opened).
During the past 10 bars, there have been 5 white candles and 5 black candles. During the past 50 bars, there have been 29 white candles and 21 black candles for a net of 8 white candles.
Momentum Indicators
Momentum is a general term used to describe the speed at which prices move over a given time period. Generally, changes in momentum tend to lead to changes in prices. This expert shows the current values of four popular momentum indicators.
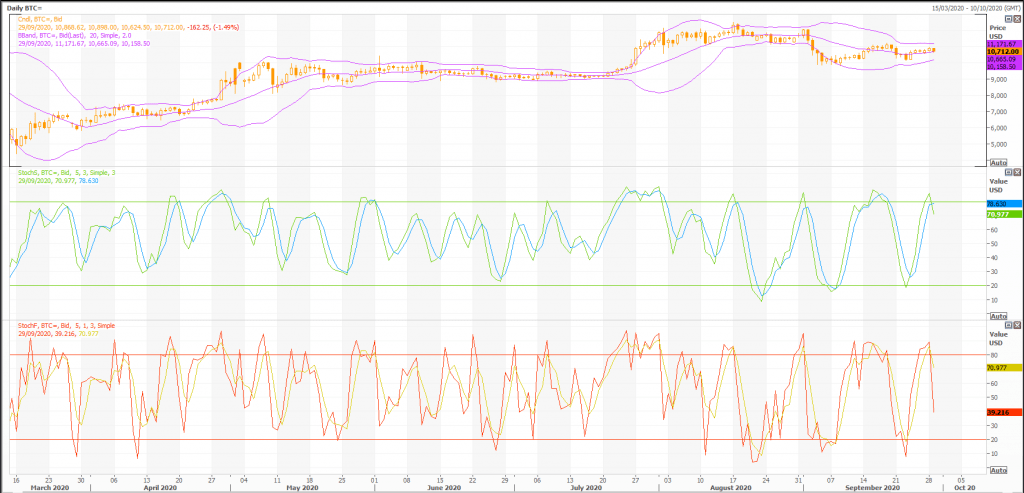
Stochastic Oscillator
One method of interpreting the Stochastic Oscillator is looking for overbought areas (above 80) and oversold areas (below 20). The Stochastic Oscillator is 76.3710. This is not an overbought or oversold reading. The last signal was a sell 0 period(s) ago.
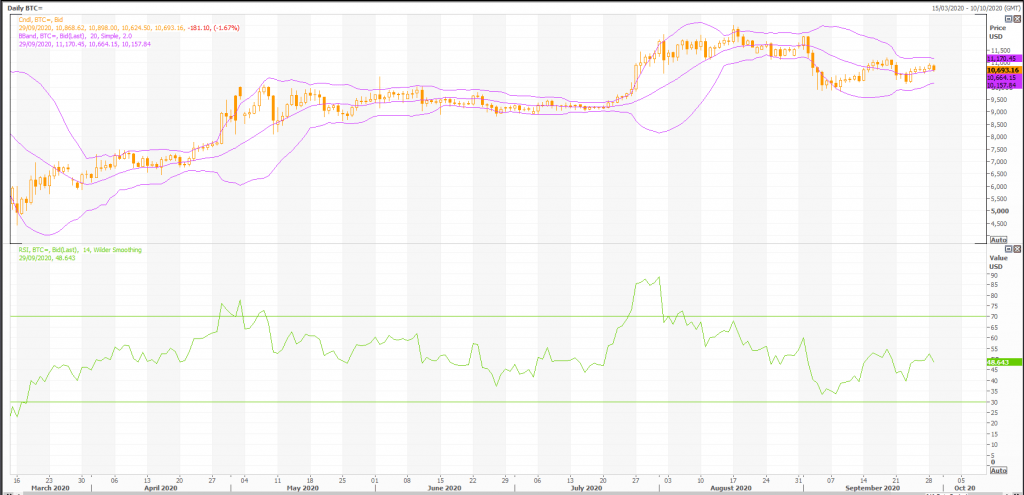
Relative Strength Index (RSI)
The RSI shows overbought (above 70) and oversold (below 30) areas. The current value of the RSI is 48.95. This is not a topping or bottoming area. A buy or sell signal is generated when the RSI moves out of an overbought/oversold area. The last signal was a sell 53 period(s) ago.
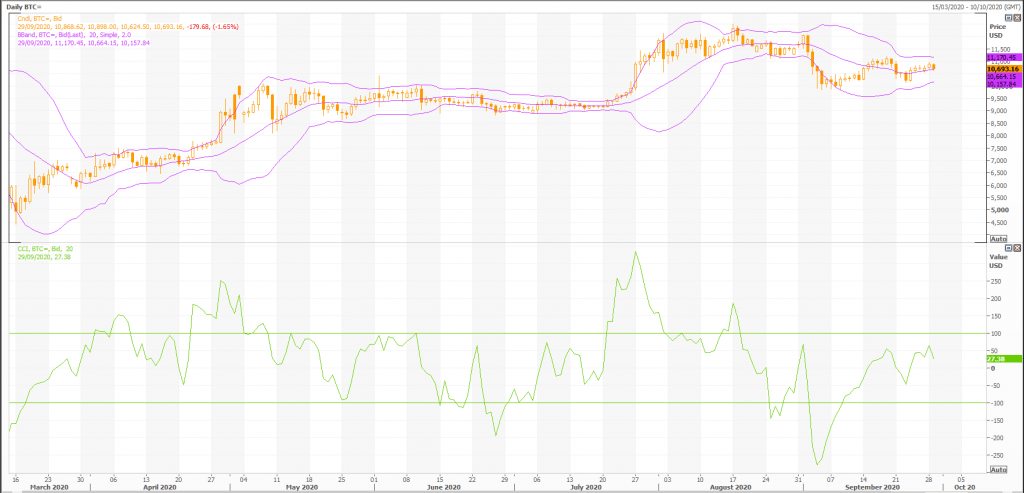
Commodity Channel Index (CCI)
The CCI shows overbought (above 100) and oversold (below -100) areas. The current value of the CCI is 2. This is not a topping or bottoming area. The last signal was a sell 9 period(s) ago.
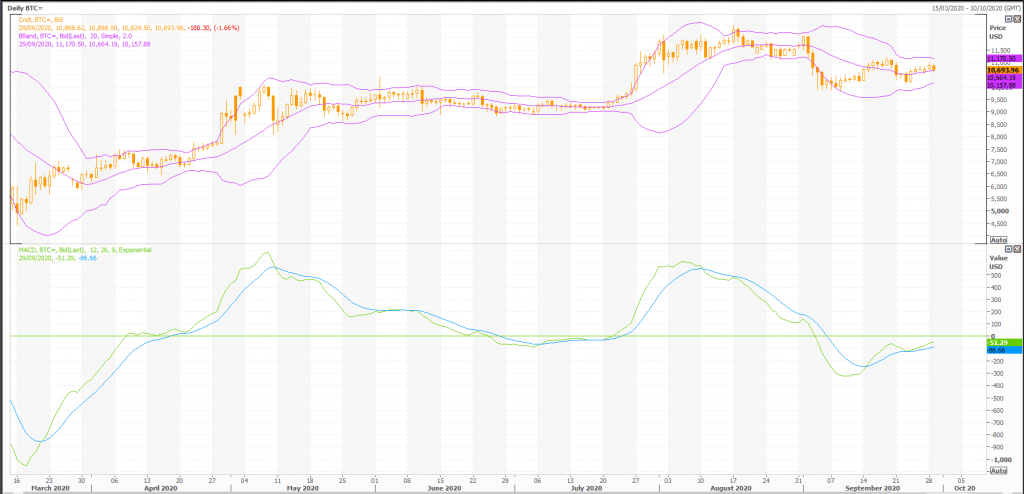
MACD
The Moving Average Convergence/Divergence indicator (MACD) gives signals when it crosses its 9 period signal line. The last signal was a buy 3 period(s) ago.
Rex Takasugi – TD Profile
FOREX BTC= closed down -165.250 at 10,709.000. Volume was 77% below average (consolidating) and Bollinger Bands were 37% narrower than normal.
Open High Low Close Volume 10,868.620 10,898.000 10,624.500 10,709.000 161,319 Technical Outlook Short Term: Neutral Intermediate Term: Bullish Long Term: Bullish Moving Averages: 10-period 50-period 200-period Close: 10,649.37 11,071.55 9,318.62 Volatility: 41 46 70 Volume: 459,405 726,963 592,008
Short-term traders should pay closer attention to buy/sell arrows while intermediate/long-term traders should place greater emphasis on the Bullish or Bearish trend reflected in the lower ribbon.
Summary
FOREX BTC= is currently 14.9% above its 200-period moving average and is in an upward trend. Volatility is extremely low when compared to the average volatility over the last 10 periods. There is a good possibility that there will be an increase in volatility along with sharp price fluctuations in the near future.
Our volume indicators reflect volume flowing into and out of BTC= at a relatively equal pace (neutral). Our trend forecasting oscillators are currently bullish on BTC= and have had this outlook for the last 2 periods.