
Australian Dollar: AUD/USD (AUD=X) Poised For More Gains – Live Trading News
Australian Dollar News
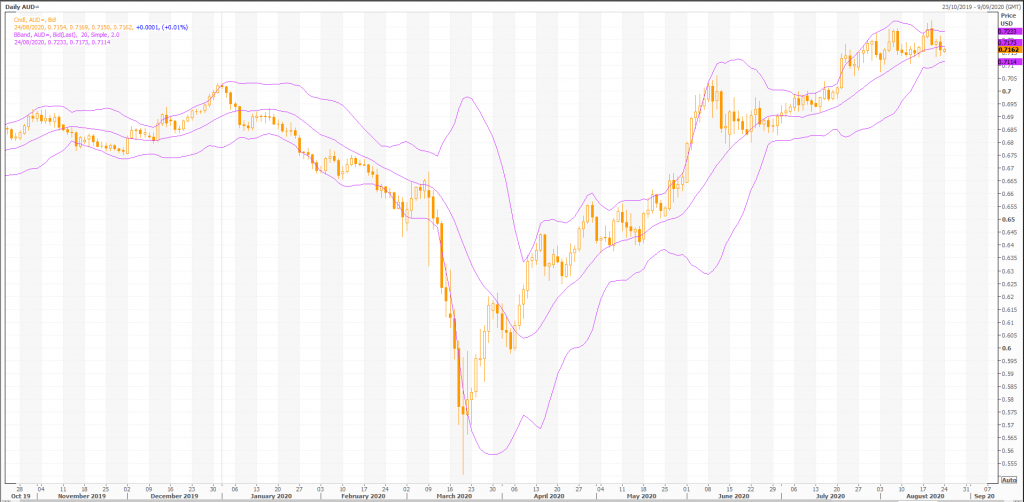
The Aussie has been on a nice run as it touched on a 12 month high at 0.7269 earlier in the week, but has come down to open at 0.7160 this morning after sliding due to strong US PMI data. From a technical perspective, traders will watch to see if the AUD can break the 0.7200 barrier again and push upwards based on the talks at the Jackson Hole Economic Policy Symposium later in the week.
Apart from those talks, it is a quiet week for the AUD in terms of local macroeconomic news with only the Australian Bureau of Statistics releasing figures on construction work and private capital expenditure on Wednesday and Thursday respectively.
AUD/US Dollar Exchange Rate
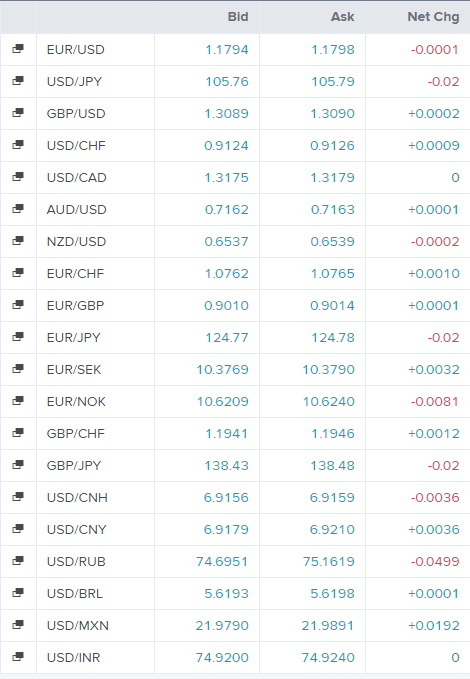
Today’s Forex Rates
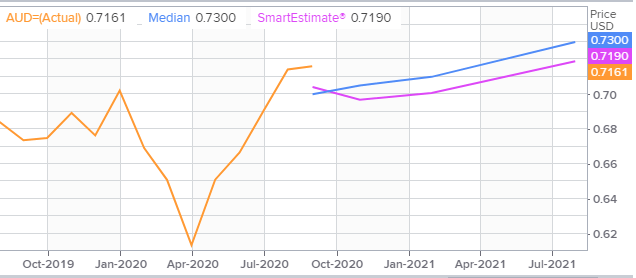
AUD/US Dollar FX Polls
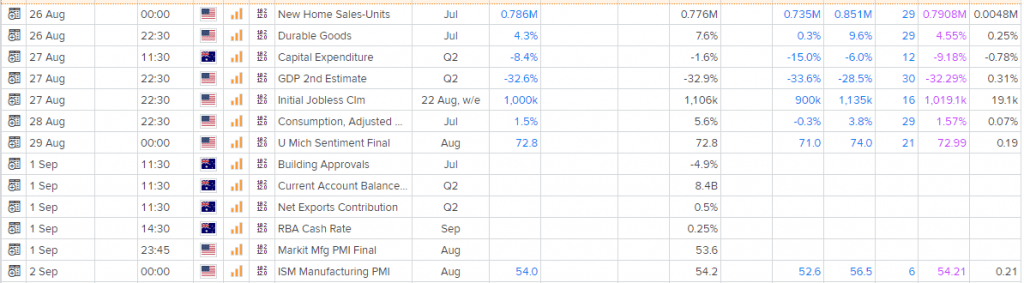
Economic Events
Technical Indicators
Overall, the bias in prices is: Upwards.
The projected upper bound is: 0.73.
The projected lower bound is: 0.71.
The projected closing price is: 0.72.
Candlesticks
A white body occurred (because prices closed higher than they opened).
During the past 10 bars, there have been 6 white candles and 4 black candles for a net of 2 white candles. During the past 50 bars, there have been 30 white candles and 20 black candles for a net of 10 white candles.
A spinning top occurred (a spinning top is a candle with a small real body). Spinning tops identify a session in which there is little price action (as defined by the difference between the open and the close). During a rally or near new highs, a spinning top can be a sign that prices are losing momentum and the bulls may be in trouble.
Momentum Indicators
Momentum is a general term used to describe the speed at which prices move over a given time period. Generally, changes in momentum tend to lead to changes in prices. This expert shows the current values of four popular momentum indicators.
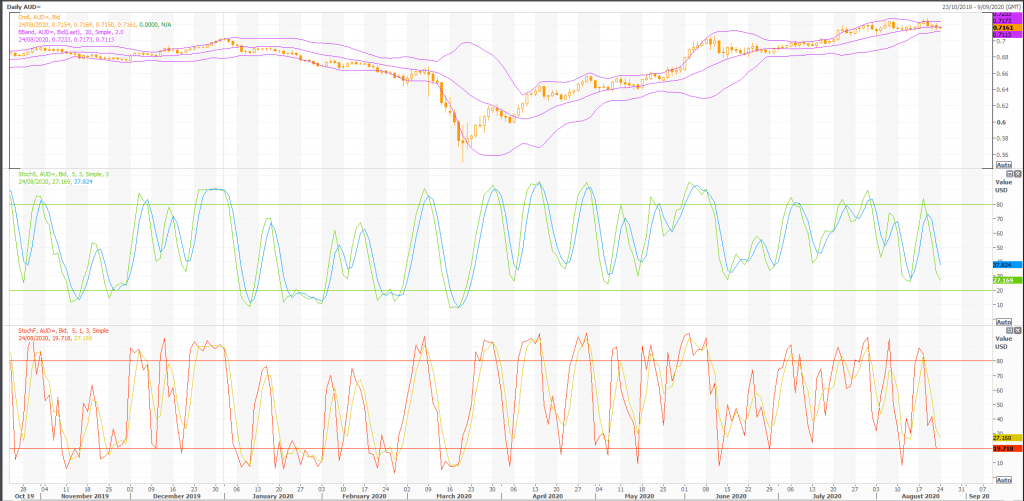
Stochastic Oscillator
One method of interpreting the Stochastic Oscillator is looking for overbought areas (above 80) and oversold areas (below 20). The Stochastic Oscillator is 27.0396. This is not an overbought or oversold reading. The last signal was a sell 3 period(s) ago.
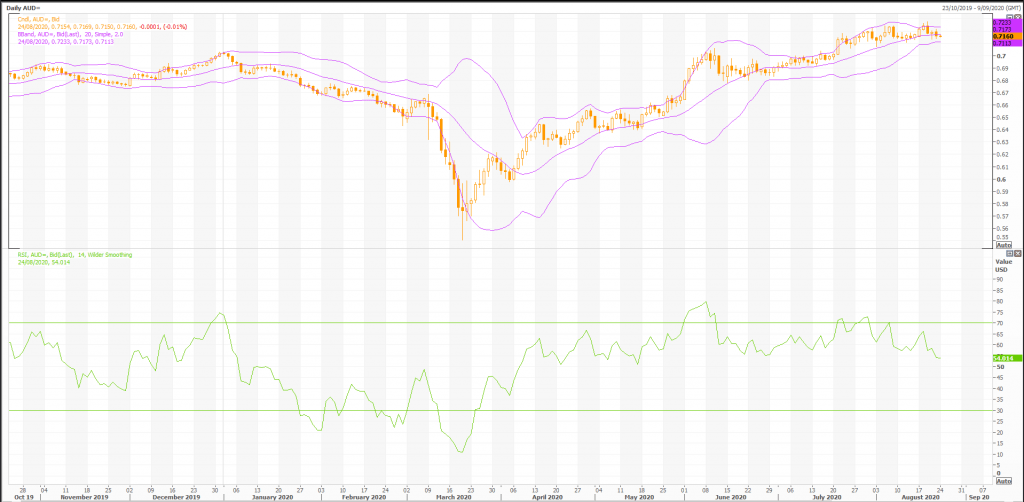
Relative Strength Index (RSI)
The RSI shows overbought (above 70) and oversold (below 30) areas. The current value of the RSI is 54.01. This is not a topping or bottoming area. A buy or sell signal is generated when the RSI moves out of an overbought/oversold area. The last signal was a sell 11 period(s) ago.
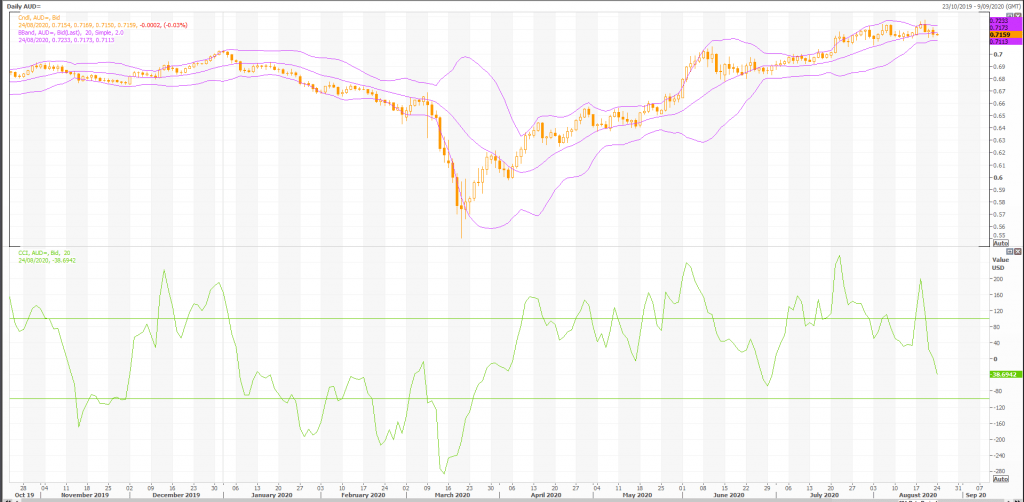
Commodity Channel Index (CCI)
The CCI shows overbought (above 100) and oversold (below -100) areas. The current value of the CCI is -59. This is not a topping or bottoming area. The last signal was a sell 3 period(s) ago.
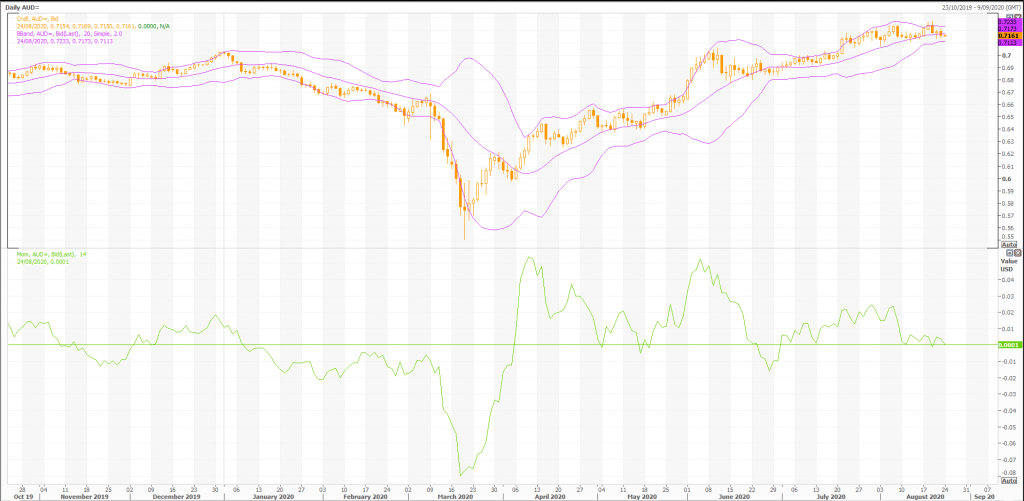
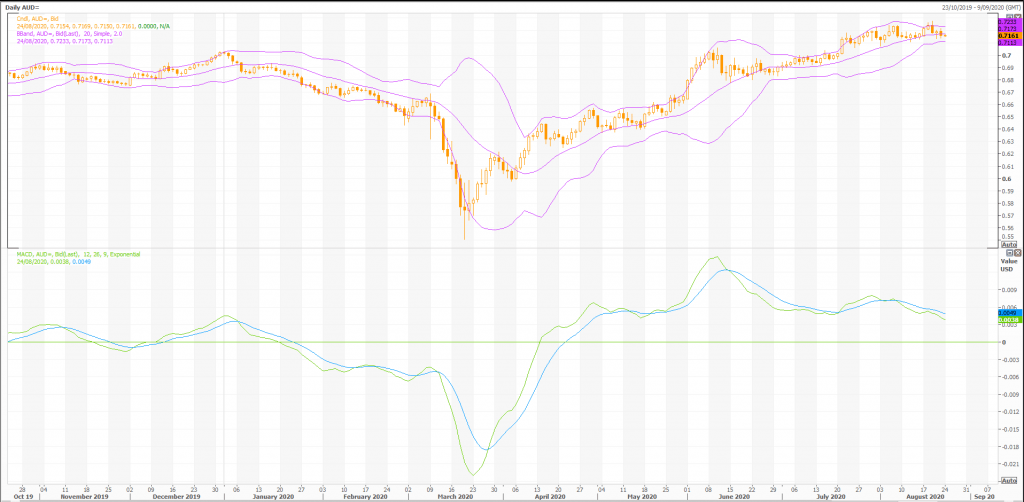
MACD
The Moving Average Convergence/Divergence indicator (MACD) gives signals when it crosses its 9 period signal line. The last signal was a sell 14 period(s) ago.
Rex Takasugi – TD Profile
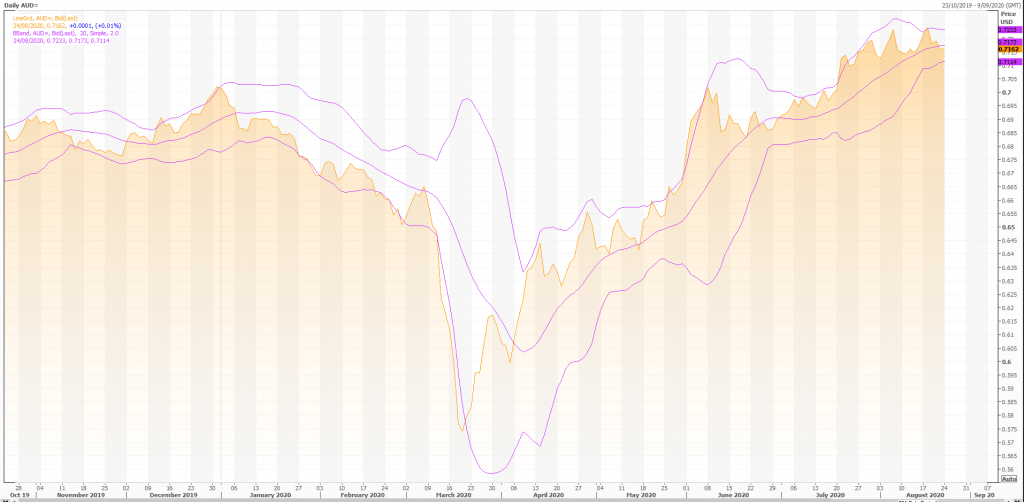
FOREX AUD= closed down -0.000 at 0.716. Volume was 90% below average (consolidating) and Bollinger Bands were 66% narrower than normal.
Open High Low Close Volume 0.715 0.717 0.715 0.716 9,300 Technical Outlook Short Term: Neutral Intermediate Term: Bullish Long Term: Bullish Moving Averages: 10-period 50-period 200-period Close: 0.72 0.70 0.67 Volatility: 8 9 15 Volume: 64,962 86,341 79,045
Short-term traders should pay closer attention to buy/sell arrows while intermediate/long-term traders should place greater emphasis on the Bullish or Bearish trend reflected in the lower ribbon.
Summary
FOREX AUD= is currently 6.5% above its 200-period moving average and is in an upward trend. Volatility is extremely low when compared to the average volatility over the last 10 periods. There is a good possibility that there will be an increase in volatility along with sharp price fluctuations in the near future.
Our volume indicators reflect volume flowing into and out of AUD= at a relatively equal pace (neutral). Our trend forecasting oscillators are currently bullish on AUD= and have had this outlook for the last 23 periods. our momentum oscillator has set a new 14-period low while the security price has not. This is a bearish divergence.