
Apple (NASDAQ:AAPL) Current Price Movement Open For Both Directions – Live Trading News
$AAPL #Apple #iPhone #StockSplit #USA #Nasdaq #Stocks #Trading
Apple
Ticker: NASDAQ:AAPL
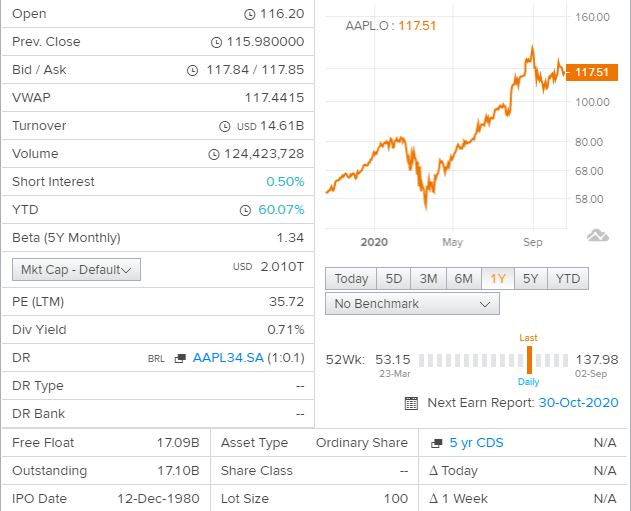
Price: $117.51
Apple Outlook
Apple (NASDAQ:AAPL) launched four new iPhone 5G models, but the needle didn’t really move much as a result of the event. The fact is AAPL stock is probably overvalued at the present time. The stock may have to “grow” into its earnings for a while before there is much upside.
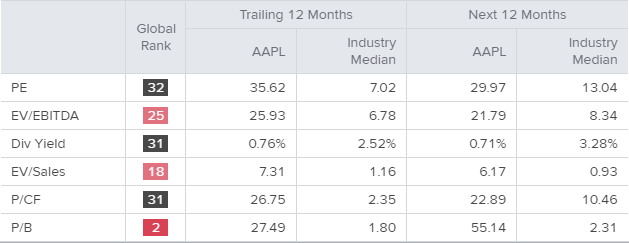
The shares trade for almost 31 times Apple’s 2021 forecast earnings per share (EPS), according to analyst data on Yahoo! Finance. And this assumes that those earnings rise by 19.4% next year. This is after rising only 9% this year, based on analysts’ estimates.
Moreover, AAPL stock is really at a historical peak price-to-earnings valuation.
AAPL Stock Valuation Issues
If you look at Morningstar’s record of Apple’s annual average P/E ratios, you can see this. The research provider reports that the average annual P/E multiple is only 17.75x for the past five years. And that includes this year’s mid-to-high 30x P/E.
So that implies that at today’s 31x forward earnings, the stock will either have to fall or it could languish a while.
For example, assuming that earnings grow by 20% for three years, the EPS in 2023 would reach $5.57 or so. Therefore, assuming AAPL stock doesn’t move much over that time, the P/E ratio would fall to 21x or so. This would be closer to its historical multiple.
And don’t be too skeptical of this scenario. It could easily happen.
But the truth is AAPL stock has performed quite well over the long term. There seems to be every good reason why this will continue.
For example, over the past five years, it is up 329%. That works out to an impressive average annual compound return of 33.8%.
Let’s hope that the company’s new 5G phones will help it continue that growth.
Business Summary
Apple Inc. designs, manufactures and markets mobile communication and media devices, personal computers and portable digital music players.
The Company sells a range of related software, services, accessories, networking solutions, and third-party digital content and applications.
The Company’s segments include the Americas, Europe, Greater China, Japan and Rest of Asia Pacific.
The Americas segment includes both North and South America. The Europe segment includes European countries, India, the Middle East and Africa.
The Greater China segment includes China, Hong Kong and Taiwan.
The Rest of Asia Pacific segment includes Australia and the Asian countries not included in the Company’s other operating segments.
Its products and services include iPhone, iPad, Mac, iPod, Apple Watch, Apple TV, a portfolio of consumer and professional software applications, iPhone OS (iOS), OS X and watchOS operating systems, iCloud, Apple Pay and a range of accessory, service and support offerings.
Price Performance
Relative Valuation
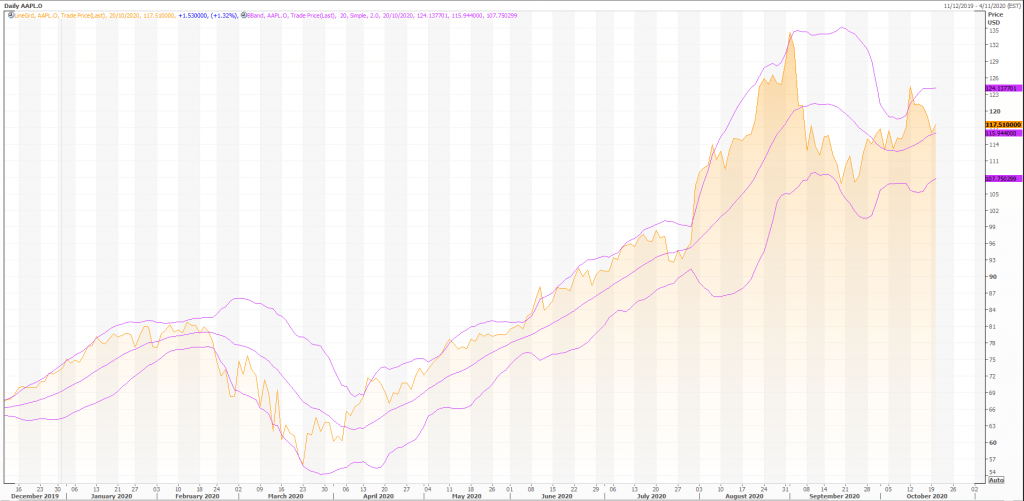
Technical Indicators
Overall, the bias in prices is: Upwards.
By the way, prices are vulnerable to a correction towards 112.66.
The projected upper bound is: 127.79.
The projected lower bound is: 107.42.
The projected closing price is: 117.61.
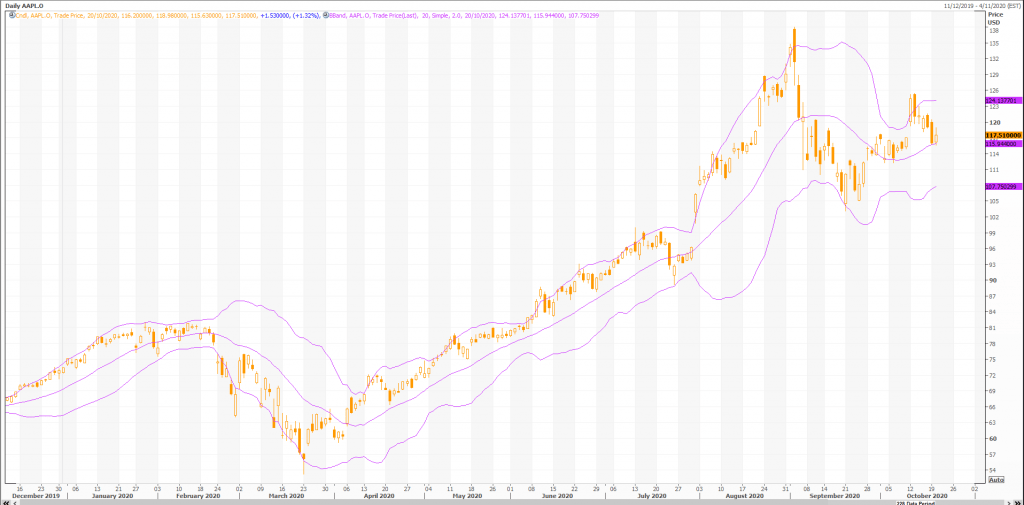
Candlesticks
A white body occurred (because prices closed higher than they opened).
During the past 10 bars, there have been 6 white candles and 4 black candles for a net of 2 white candles. During the past 50 bars, there have been 26 white candles and 24 black candles for a net of 2 white candles.
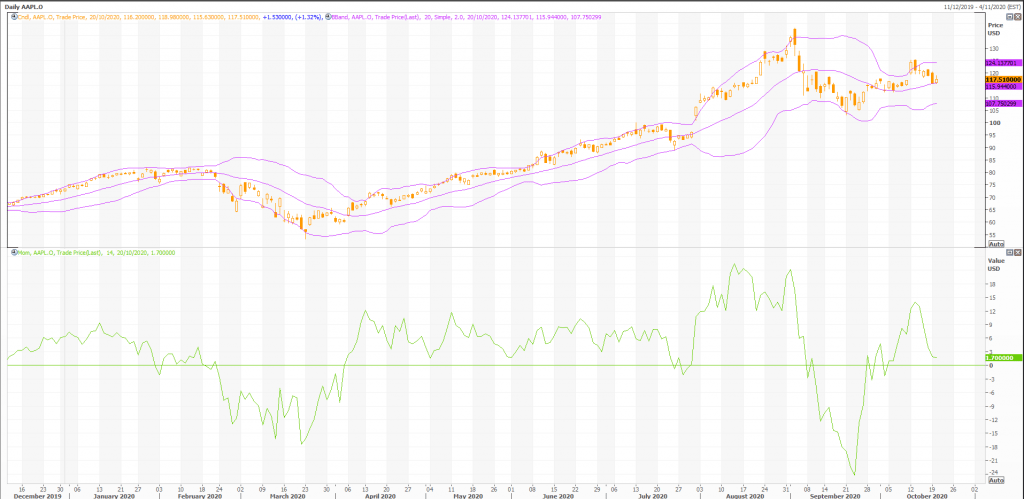
Momentum Indicators
Momentum is a general term used to describe the speed at which prices move over a given time period. Generally, changes in momentum tend to lead to changes in prices. This expert shows the current values of four popular momentum indicators.
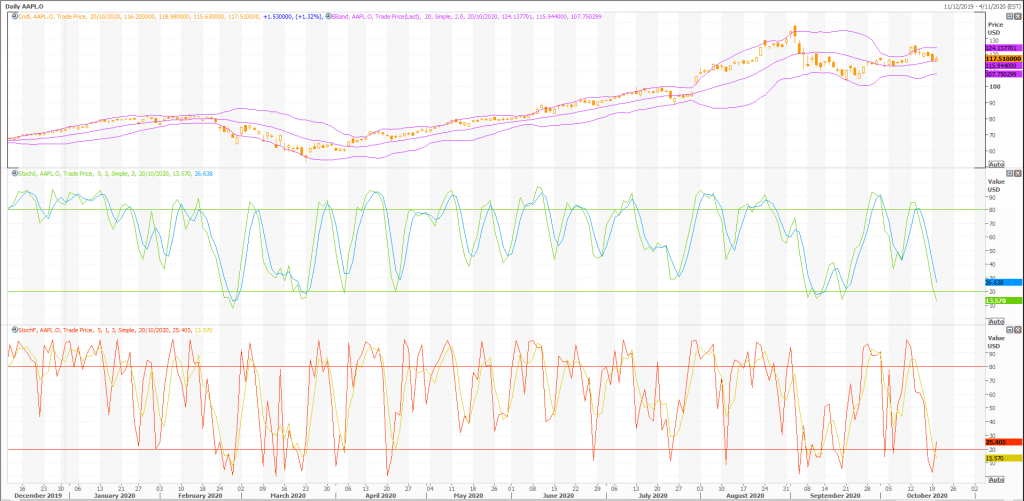
Stochastic Oscillator
One method of interpreting the Stochastic Oscillator is looking for overbought areas (above 80) and oversold areas (below 20). The Stochastic Oscillator is 12.5975. This is an oversold reading. However, a signal is not generated until the Oscillator crosses above 20 The last signal was a sell 4 period(s) ago.
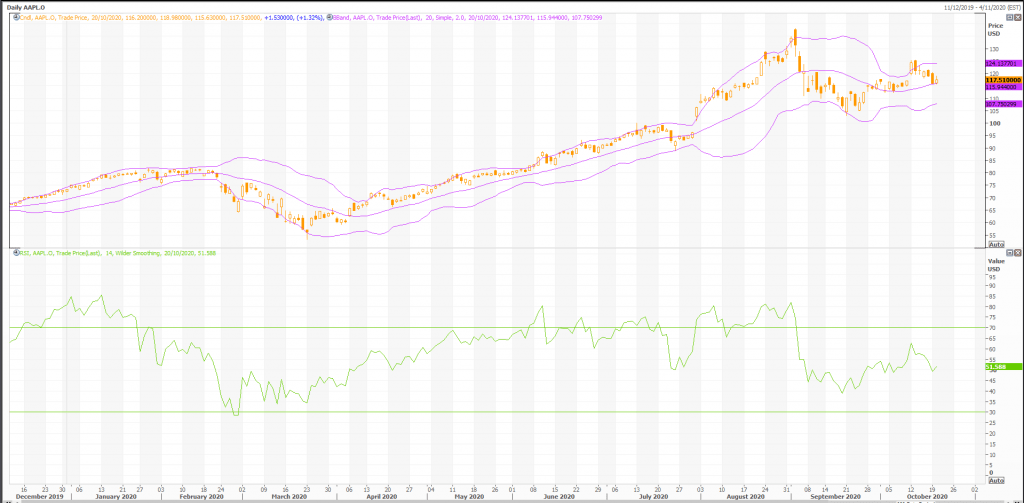
Relative Strength Index (RSI)
The RSI shows overbought (above 70) and oversold (below 30) areas. The current value of the RSI is 51.59. This is not a topping or bottoming area. A buy or sell signal is generated when the RSI moves out of an overbought/oversold area. The last signal was a sell 32 period(s) ago.
Commodity Channel Index (CCI)
The CCI shows overbought (above 100) and oversold (below -100) areas. The current value of the CCI is -7. This is not a topping or bottoming area. The last signal was a sell 3 period(s) ago.

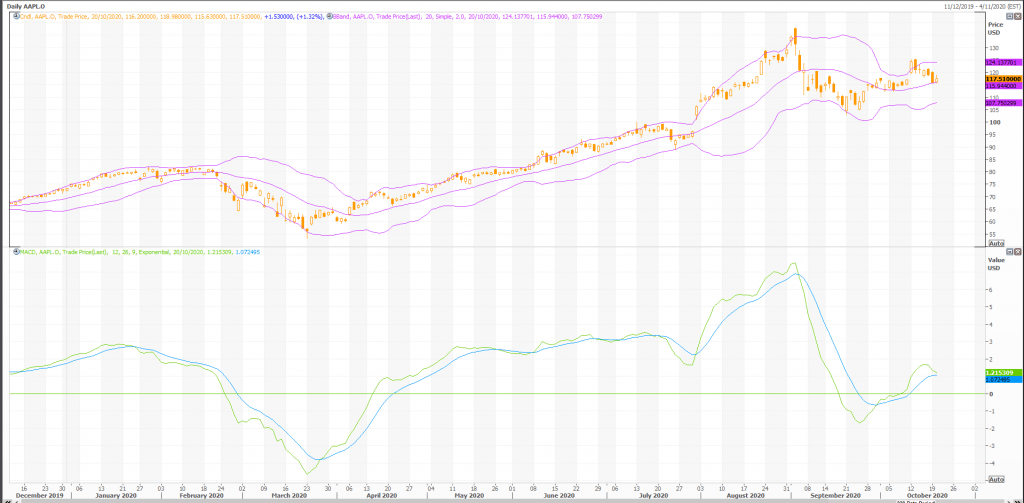
MACD
The Moving Average Convergence/Divergence indicator (MACD) gives signals when it crosses its 9 period signal line. The last signal was a buy 15 period(s) ago.
Rex Takasugi – TD Profile
APPLE INC closed up 1.530 at 117.510. Volume was 25% below average (neutral) and Bollinger Bands were 18% narrower than normal.
Open High Low Close Volume 116.200 118.980 115.630 117.510 124,423,728 Technical Outlook Short Term: Oversold Intermediate Term: Bullish Long Term: Bullish Moving Averages: 10-period 50-period 200-period Close: 118.69 117.22 89.23 Volatility: 47 55 60 Volume: 140,746,864 173,547,328 170,357,552
Short-term traders should pay closer attention to buy/sell arrows while intermediate/long-term traders should place greater emphasis on the Bullish or Bearish trend reflected in the lower ribbon.
Summary
APPLE INC is currently 31.7% above its 200-period moving average and is in an upward trend. Volatility is relatively normal as compared to the average volatility over the last 10 periods.
Our volume indicators reflect volume flowing into and out of AAPL.O at a relatively equal pace (neutral). Our trend forecasting oscillators are currently bullish on AAPL.O and have had this outlook for the last 4 periods.