
Amazon (NASDAQ:AMZN) Stock Crash Equals Bigger Discount – Live Trading News
$AMZN #Amazon #OnlineShopping #USA #Nasdaq #Stocks #Trading
Amazon
Ticker: NASDAQ:AMZN
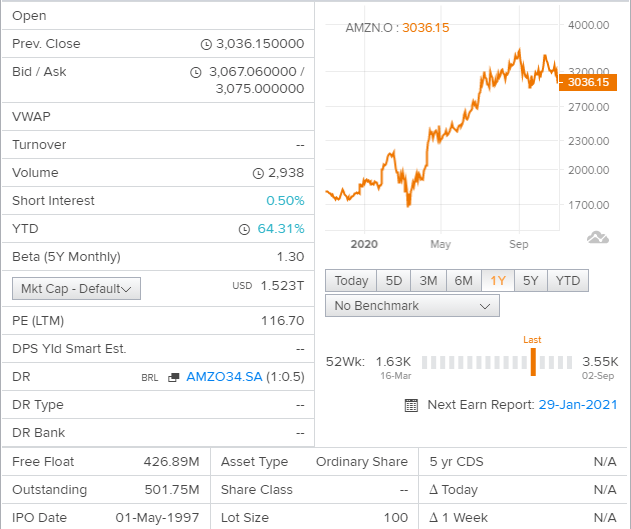
Price: $3036.15
Amazon News
A week ago, Amazon.com came out with a strong set of third-quarter numbers that could potentially lead to a re-rate of the stock. The company beat both earnings and revenue forecasts, with revenue of US$96b, some 3.8% above estimates, and statutory earnings per share (EPS) coming in at US$12.37, 66% ahead of expectations. This is an important time for investors, as they can track a company’s performance in its report, look at what experts are forecasting for next year, and see if there has been any change to expectations for the business.
Analysts reconfirmed their price target of US$3,794, showing that the business is executing well and in line with expectations. There’s another way to think about price targets though, and that’s to look at the range of price targets put forward by analysts, because a wide range of estimates could suggest a diverse view on possible outcomes for the business. Currently, the most bullish analyst values Amazon.com at US$4,500 per share, while the most bearish prices it at US$3,360. These price targets show that analysts do have some differing views on the business, but the estimates do not vary enough to suggest to us that some are betting on wild success or utter failure.
Taking a look at the bigger picture now, one of the ways we can understand these forecasts is to see how they compare to both past performance and industry growth estimates. Next year brings more of the same, according to the analysts, with revenue forecast to grow 28%, in line with its 24% annual growth over the past five years. By contrast, our data suggests that other companies (with analyst coverage) in a similar industry are forecast to see their revenues grow 18% per year. So it’s pretty clear that Amazon.com is forecast to grow substantially faster than its industry.
The Bottom Line
The most important thing to take away is that there’s been no major change in sentiment, with the analysts reconfirming that the business is performing in line with their previous earnings per share estimates. Happily, there were no major changes to revenue forecasts, with the business still expected to grow faster than the wider industry. There was no real change to the consensus price target, suggesting that the intrinsic value of the business has not undergone any major changes with the latest estimates.
Business Summary
Amazon.com, Inc. offers a range of products and services through its Websites.
The Company’s products include merchandise and content that it purchases for resale from vendors and those offered by third-party sellers. It also manufactures and sells electronic devices.
It operates through three segments: North America, International and Amazon Web Services (AWS). Its AWS products include analytics, Amazon Athena, Amazon CloudSearch, Amazon EMR, Amazon Elasticsearch Service, Amazon Kinesis, Amazon Managed Streaming for Apache Kafka, Amazon Redshift, Amazon QuickSight, AWS Data Pipeline, AWS Glue and AWS Lake Formation.
AWS solutions include machine learning, analytics and data lakes, Internet of Things, serverless computing, containers, enterprise applications, and storage. In addition, the Company provides services, such as advertising.
It also offers Amazon Prime, a membership program that includes free shipping, access to streaming of various movies and television (TV) episodes.
Price Performance
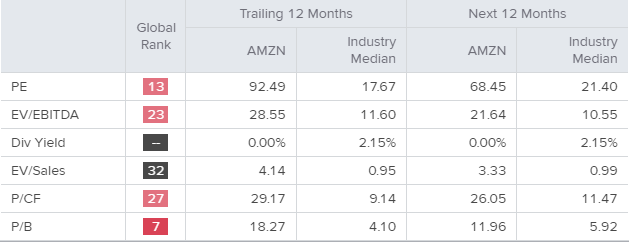
Relative Valuation
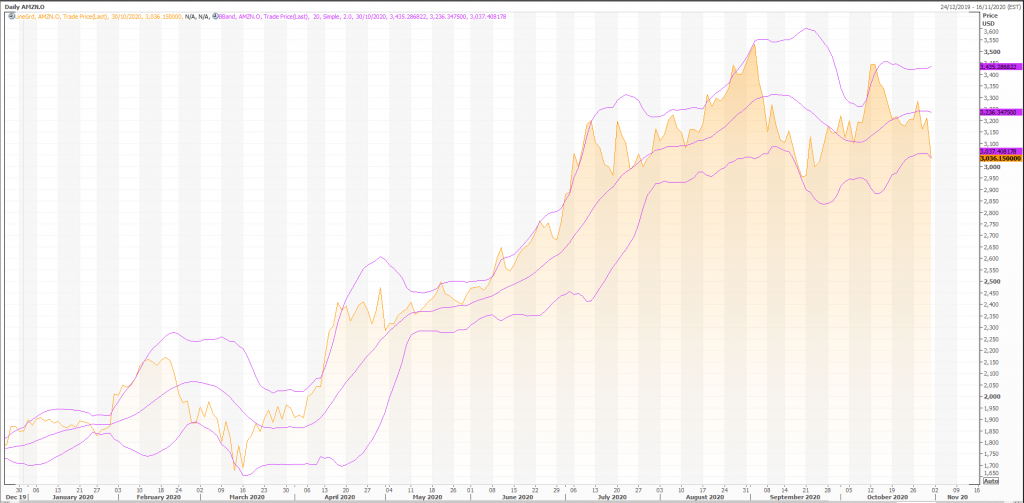
Technical Indicators
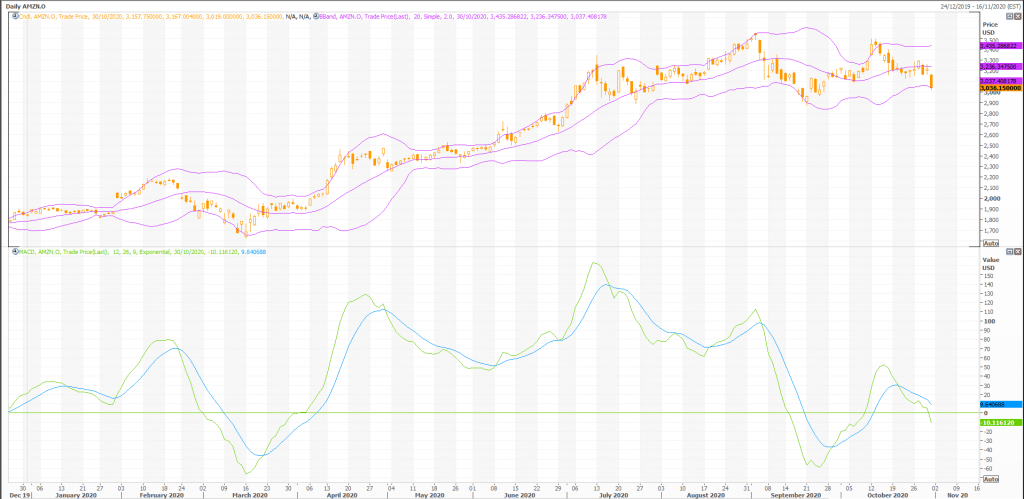
Overall, the bias in prices is: Downwards.
The projected upper bound is: 3,269.70.
The projected lower bound is: 2,792.15.
The projected closing price is: 3,030.93.
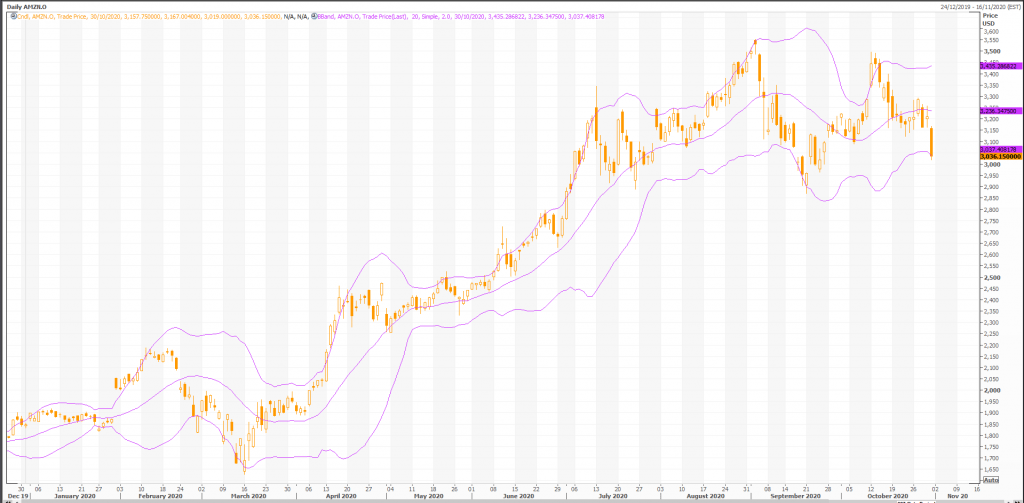
Candlesticks
A big black candle occurred. This is bearish, as prices closed significantly lower than they opened. If the candle appears when prices are “high,” it may be the first sign of a top. If it occurs when prices are confronting an overhead resistance area (e.g., a moving average, trendline, or price resistance level), the long black candle adds credibility to the resistance. Similarly, if the candle appears as prices break below a support area, the long black candle confirms the failure of the support area.
During the past 10 bars, there have been 4 white candles and 6 black candles for a net of 2 black candles. During the past 50 bars, there have been 23 white candles and 27 black candles for a net of 4 black candles.
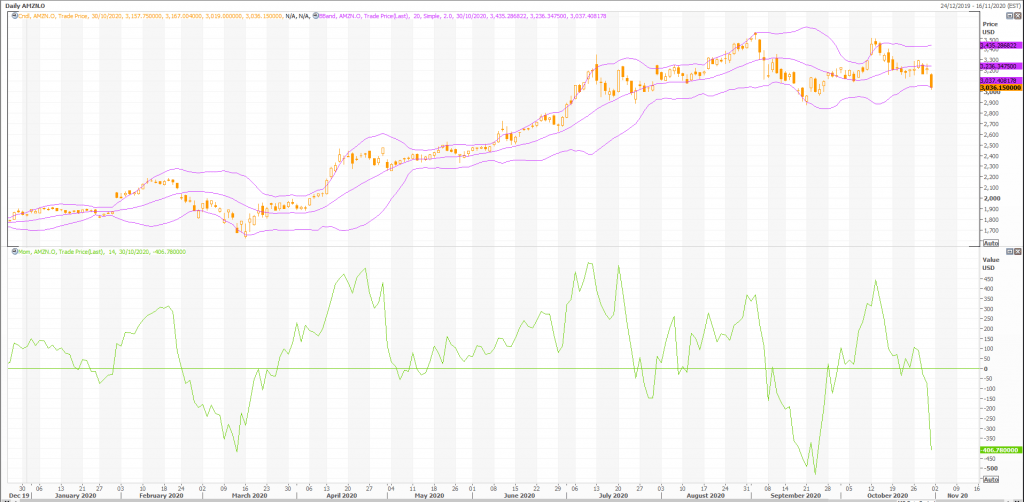
Momentum Indicators
Momentum is a general term used to describe the speed at which prices move over a given time period. Generally, changes in momentum tend to lead to changes in prices. This expert shows the current values of four popular momentum indicators.
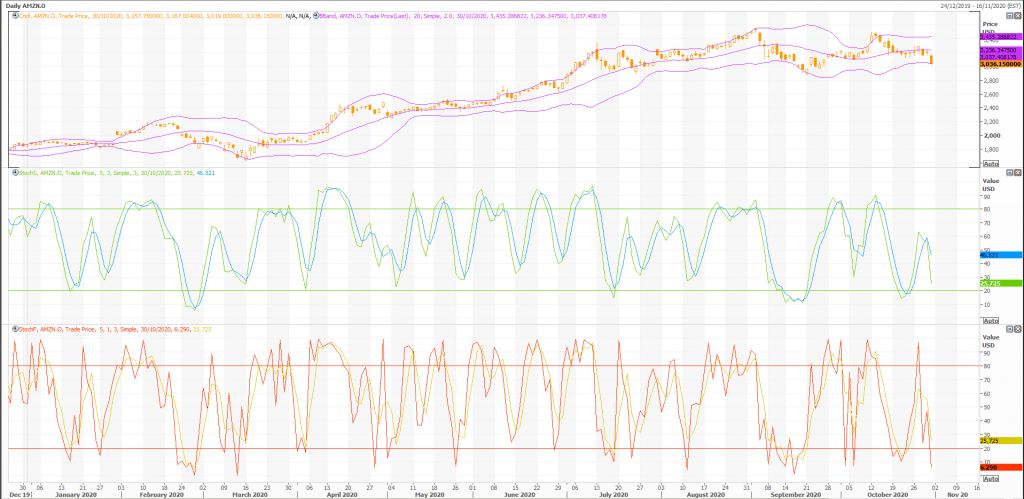
Stochastic Oscillator
One method of interpreting the Stochastic Oscillator is looking for overbought areas (above 80) and oversold areas (below 20). The Stochastic Oscillator is 21.7157. This is not an overbought or oversold reading. The last signal was a buy 5 period(s) ago.
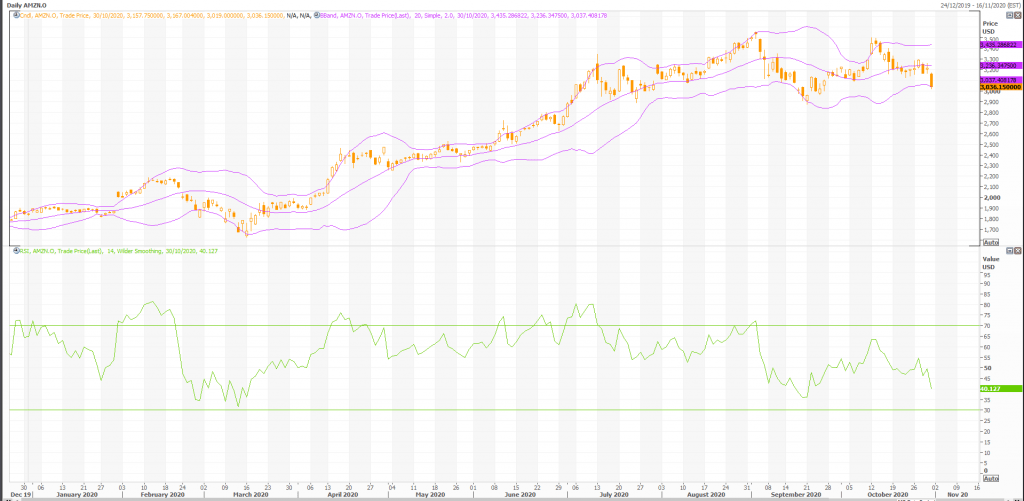
Relative Strength Index (RSI)
The RSI shows overbought (above 70) and oversold (below 30) areas. The current value of the RSI is 40.13. This is not a topping or bottoming area. A buy or sell signal is generated when the RSI moves out of an overbought/oversold area. The last signal was a sell 40 period(s) ago.
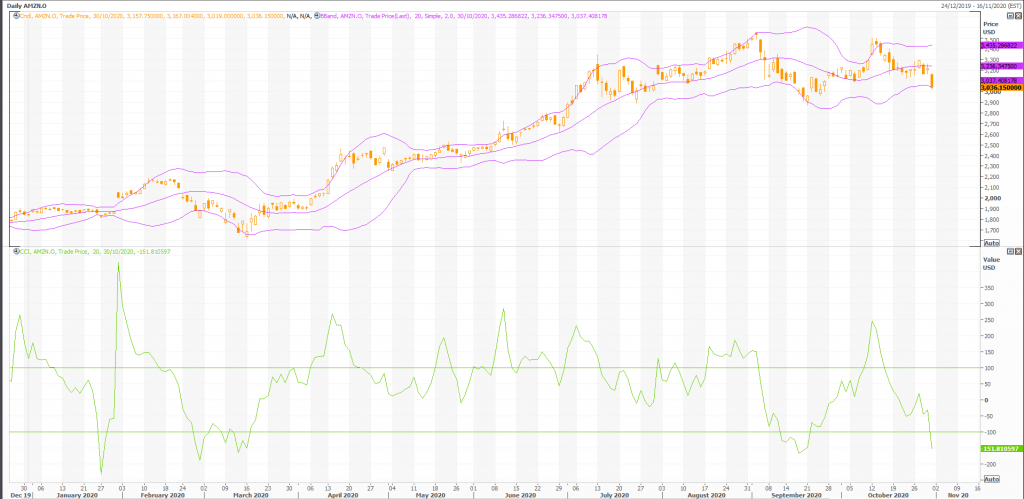
Commodity Channel Index (CCI)
The CCI shows overbought (above 100) and oversold (below -100) areas. The current value of the CCI is -162.This is an oversold reading. However, a signal isn’t generated until the indicator crosses above -100. The last signal was a sell 11 period(s) ago.
MACD
The Moving Average Convergence/Divergence indicator (MACD) gives signals when it crosses its 9 period signal line. The last signal was a sell 8 period(s) ago.
Rex Takasugi – TD Profile
AMAZON COM closed down -174.860 at 3,036.150. Volume was 100% below average (consolidating) and Bollinger Bands were 16% narrower than normal.
Open High Low Close Volume 3,157.750 3,167.004 3,019.000 3,036.150 3,440 Technical Outlook Short Term: Neutral Intermediate Term: Bullish Long Term: Bullish Moving Averages: 10-period 50-period 200-period Close: 3,189.33 3,221.64 2,621.55 Volatility: 45 47 49 Volume: 4,438,523 5,078,416 5,169,412
Short-term traders should pay closer attention to buy/sell arrows while intermediate/long-term traders should place greater emphasis on the Bullish or Bearish trend reflected in the lower ribbon.
Summary
AMAZON COM is currently 15.8% above its 200-period moving average and is in an upward trend. Volatility is high as compared to the average volatility over the last 10 periods. Our volume indicators reflect volume flowing into and out of AMZN.O at a relatively equal pace (neutral). Our trend forecasting oscillators are currently bullish on AMZN.O and have had this outlook for the last 14 periods.