
A Look At The Euro: EUR/USD (EUR=X) Technicals – Live Trading News
Euro/US Dollar Exchange Rate
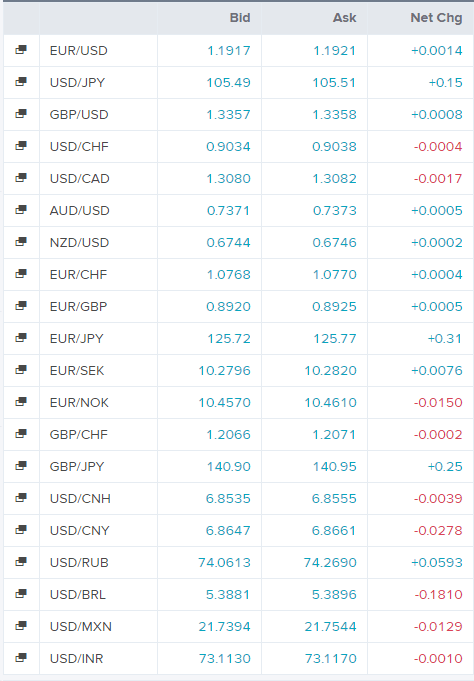
Today’s Forex Rates
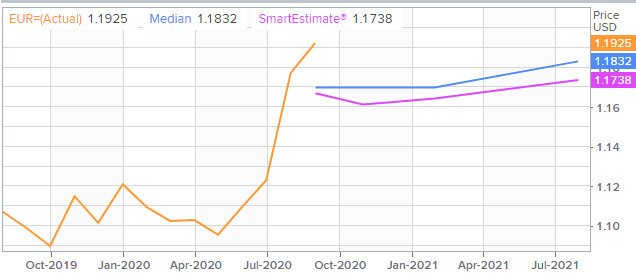
Euro/US Dollar FX Polls
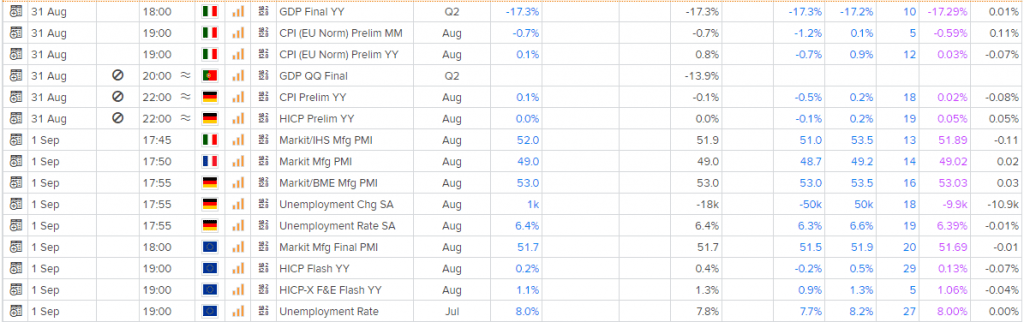
Economic Events
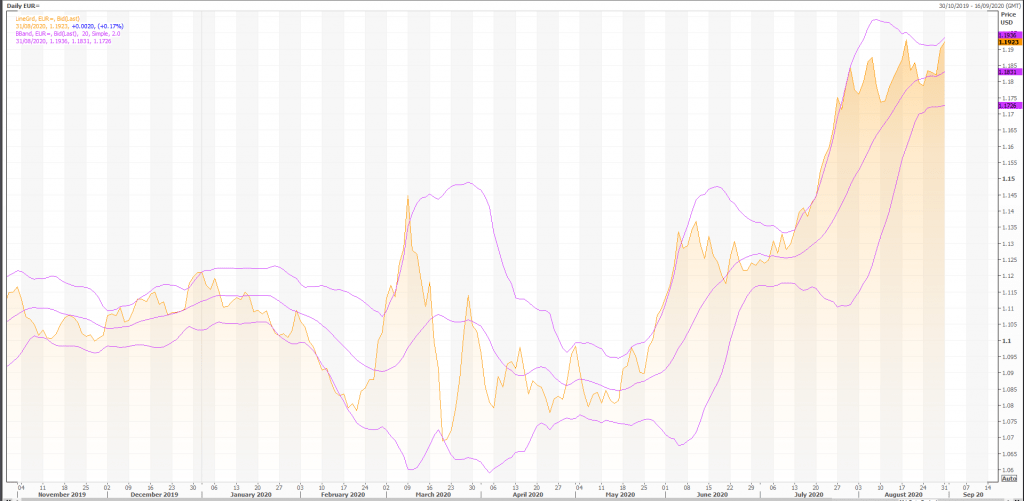
Technical Indicators
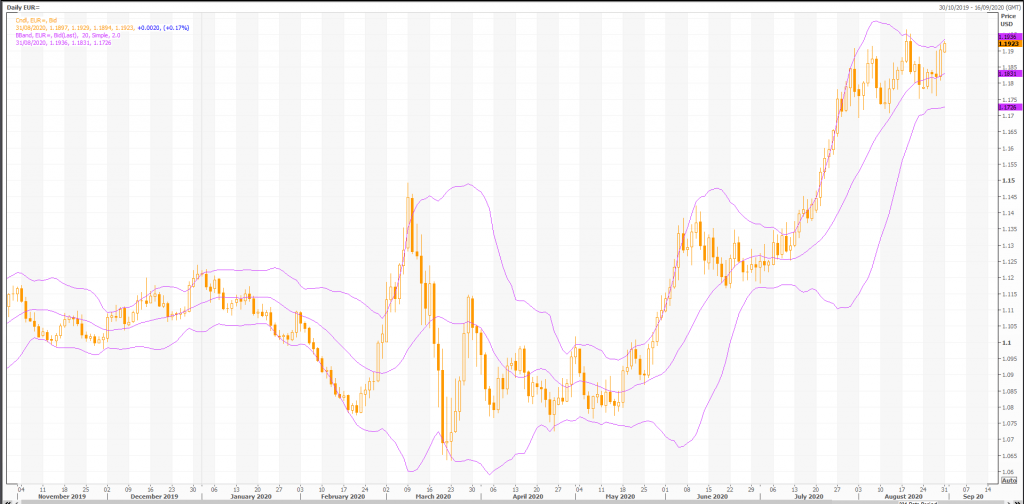
Overall, the bias in prices is: Upwards.
The projected upper bound is: 1.21.
The projected lower bound is: 1.18.
The projected closing price is: 1.19.
Candlesticks
A white body occurred (because prices closed higher than they opened).
During the past 10 bars, there have been 6 white candles and 4 black candles for a net of 2 white candles. During the past 50 bars, there have been 33 white candles and 16 black candles for a net of 17 white candles.
Momentum Indicators
Momentum is a general term used to describe the speed at which prices move over a given time period. Generally, changes in momentum tend to lead to changes in prices. This expert shows the current values of four popular momentum indicators.
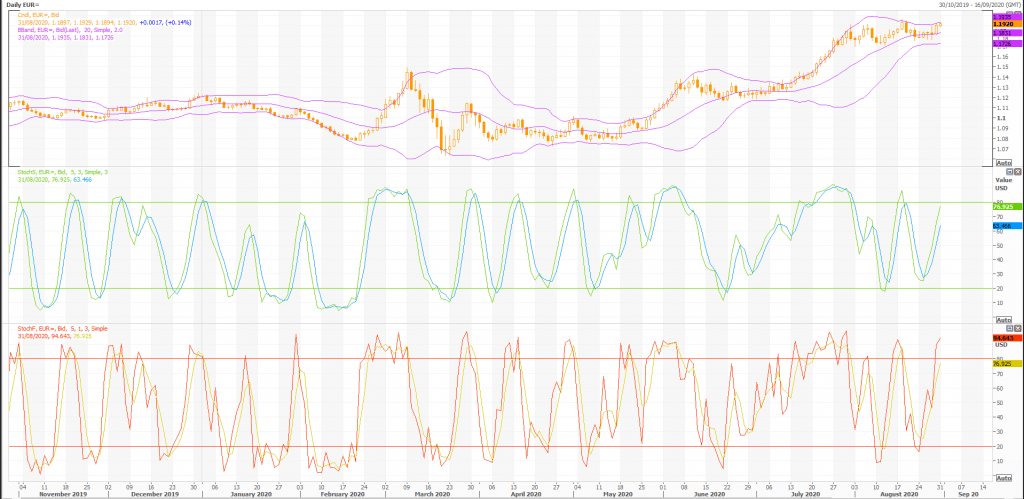
Stochastic Oscillator
One method of interpreting the Stochastic Oscillator is looking for overbought areas (above 80) and oversold areas (below 20). The Stochastic Oscillator is 77.8014. This is not an overbought or oversold reading. The last signal was a sell 8 period(s) ago.
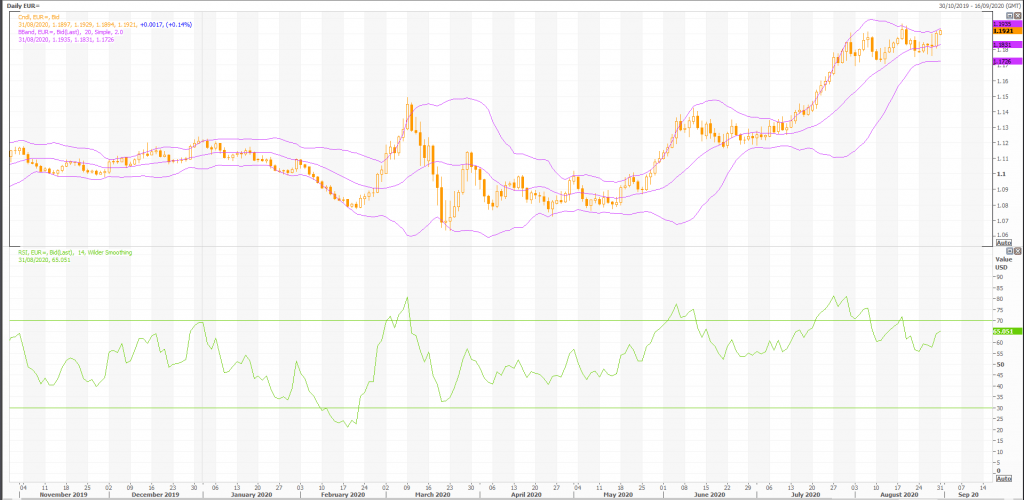
Relative Strength Index (RSI)
The RSI shows overbought (above 70) and oversold (below 30) areas. The current value of the RSI is 64.93. This is not a topping or bottoming area. A buy or sell signal is generated when the RSI moves out of an overbought/oversold area. The last signal was a sell 8 period(s) ago.
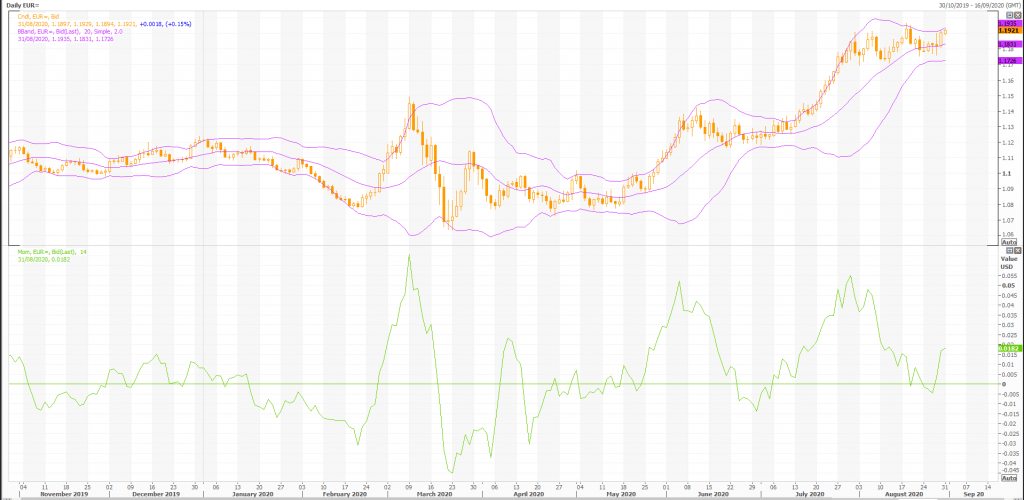
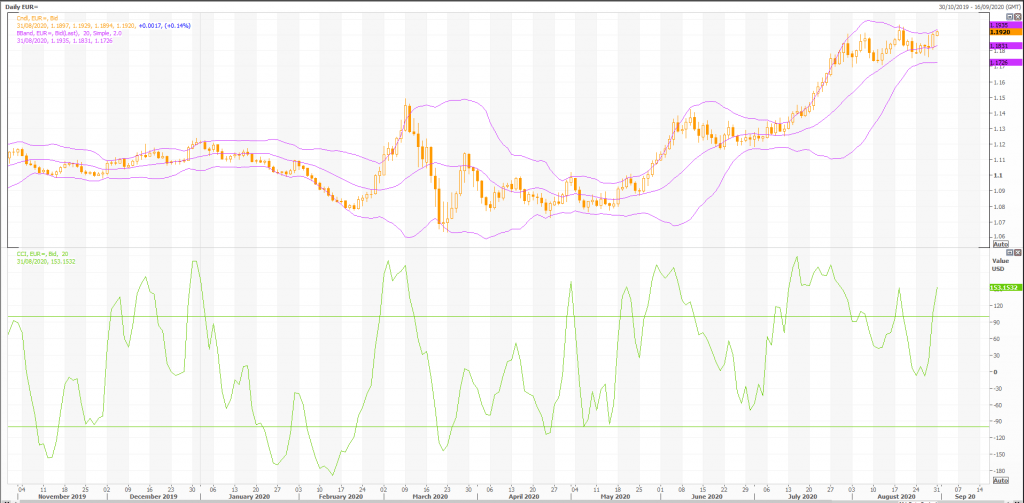
Commodity Channel Index (CCI)
The CCI shows overbought (above 100) and oversold (below -100) areas. The current value of the CCI is 143.This is an overbought reading. However, a signal isn’t generated until the indicator crosses below 100. The last signal was a sell 8 period(s) ago.
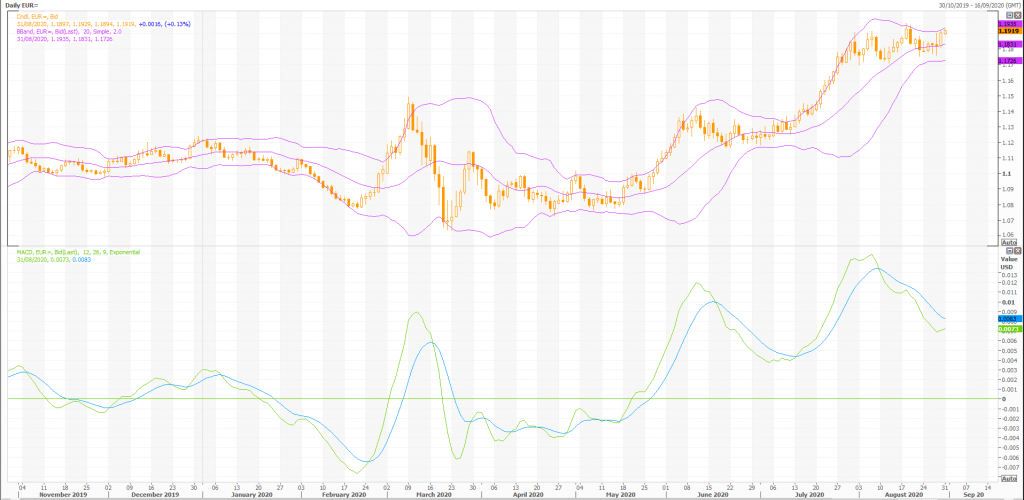
MACD
The Moving Average Convergence/Divergence indicator (MACD) gives signals when it crosses its 9 period signal line. The last signal was a sell 15 period(s) ago.
Rex Takasugi – TD Profile
FOREX EUR= closed up 0.002 at 1.192. Volume was 96% below average (consolidating) and Bollinger Bands were 45% narrower than normal.
Open High Low Close Volume 1.190 1.193 1.189 1.192 4,175 Technical Outlook Short Term: Neutral Intermediate Term: Bullish Long Term: Bullish Moving Averages: 10-period 50-period 200-period Close: 1.19 1.16 1.12 Volatility: 8 7 9 Volume: 91,887 102,798 95,918
Short-term traders should pay closer attention to buy/sell arrows while intermediate/long-term traders should place greater emphasis on the Bullish or Bearish trend reflected in the lower ribbon.
Summary
FOREX EUR= is currently 6.7% above its 200-period moving average and is in an upward trend. Volatility is low as compared to the average volatility over the last 10 periods. Our volume indicators reflect volume flowing into and out of EUR= at a relatively equal pace (neutral). Our trend forecasting oscillators are currently bullish on EUR= and have had this outlook for the last 33 periods.